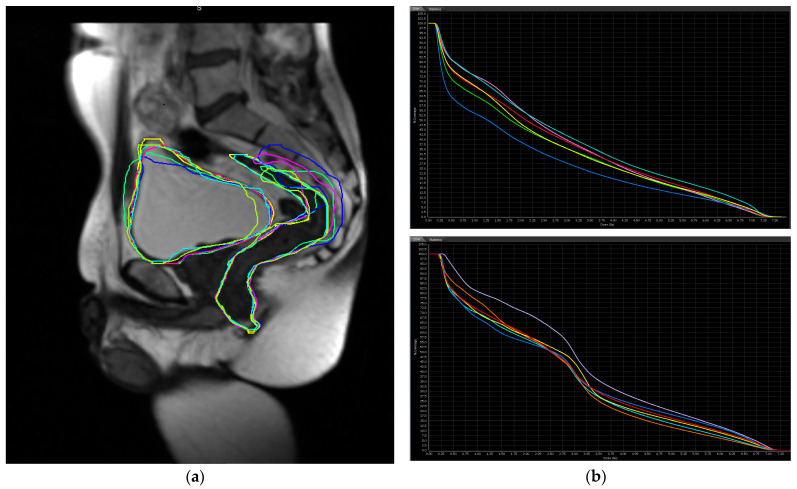
Figure 2.
(a) Sagittal MR view of the pelvis with delineation of bowel and bladder volumes across multiple treatments using an MR-guided linear accelerator. (b) Dose volume histograms showing variability in received dose to the bladder (top) and rectum (bottom) across daily treatments depending on position and indicated by different line colors.

