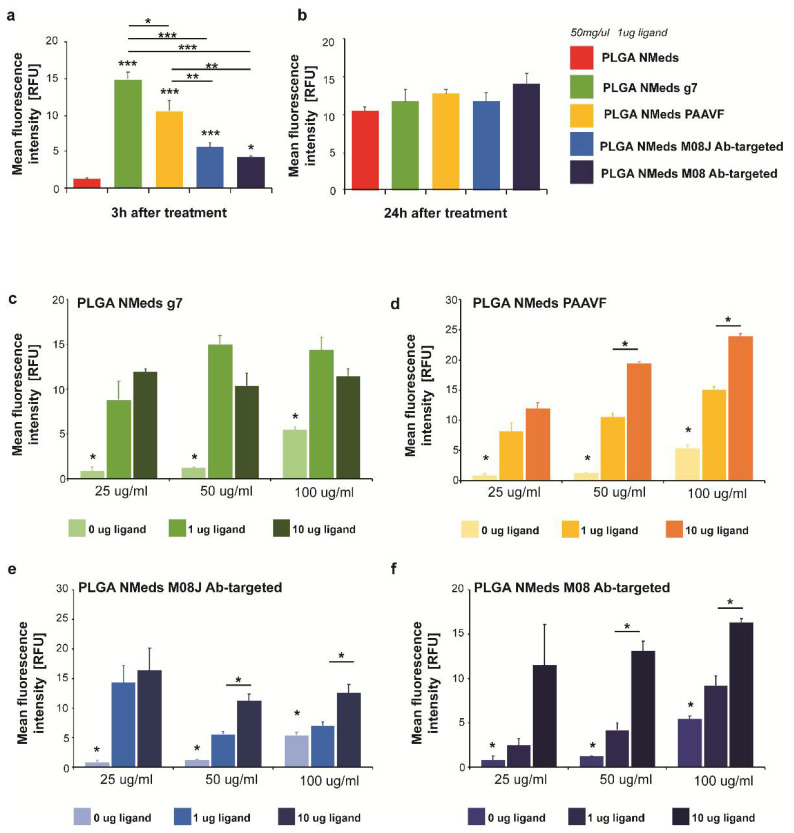
Figure 2.
C6 cell uptake of 50 µg/mL targeted and non-targeted NMeds at (a) 3 h and (b) 24 h after administration. The relative fluorescence intensity of Cy5 intracellular signals (normalised to background fluorescence of untreated cells) was measured in 10 cells from n = 3 samples per condition. (c–f) Uptake of non-modified and targeted NMeds surfaced modified with 0, 1, or 10 µg of each ligand and administered at concentrations of 25, 50, or 100 µg/mL. The relative fluorescence intensity of Cy5 intracellular signals (normalised to background fluorescence of untreated cells) was measured in 10 cells from n = 3 samples per condition. Statistical analysis was performed with one-way ANOVA and post hoc test, * p < 0.5, ** p < 0.1, *** p < 0.01. Full statistical analysis is available in Supplementary material Table S5.

