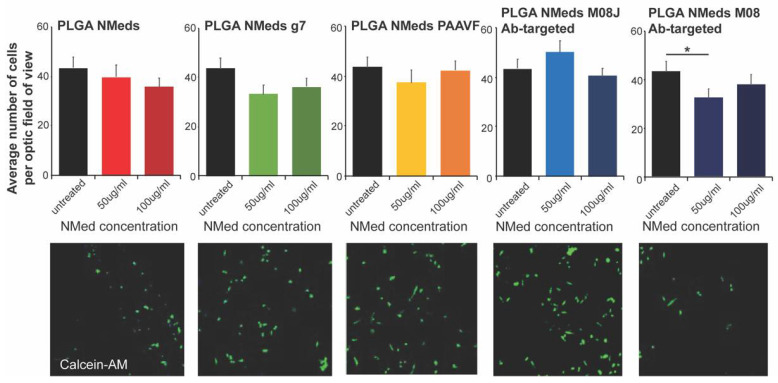
Figure 3.
Cell growth inhibition studies. Quantification (top) of the number of cells per field analysed after incubating NMeds at a concentration of 50 or 100 µg/mL for 3 h and visualised by confocal microscopy (bottom). The number of cells visualised by DAPI and Calcein-AM staining per optic fields of view (OFV) was measured by counting n = 10 OFV for each condition. Statistical analysis was performed with one-way ANOVA and Post hoc analysis, * p < 0.05.

