
FIGURE 2.
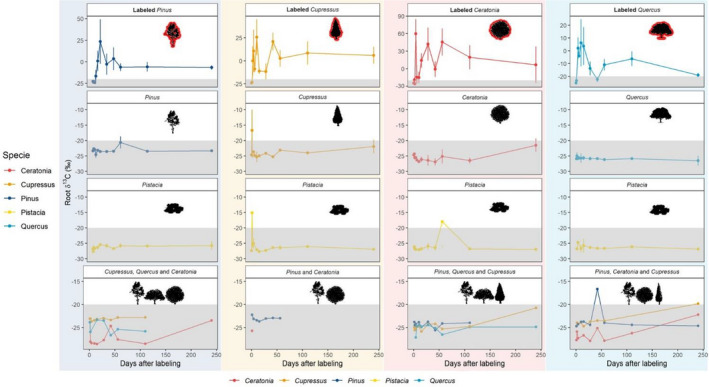
Dynamics of δ13C in roots of labelled and nonlabelled saplings of different Mediterranean tree species. δ13C values through time since labelling in saplings are shown by average and standard error in plots with different background colour for each box (box 1 – green, box 2 – yellow, box 3 – red, box 4 – blue). Saplings of the following species: Pinus halepensis; Cupressus sempervirens; Quercus calliprinos; Pistacia lentiscus and Ceratonia siliqua, in each box are represented by four facets from top to bottom: (1) Three labelled saplings of one species, (2) three nonlabelled saplings of same species, (3) three nonlabelled saplings of Pistacia, and (4) three nonlabelled saplings of the remaining species. Grey area represents δ13C values below natural values of roots of C3 plants = (–20 to –34‰) (Kohn, 2010)