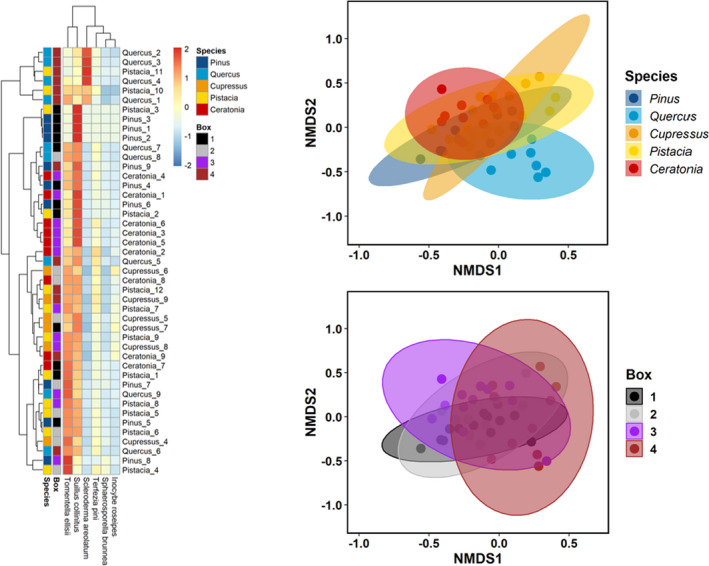
FIGURE 4.

Fungal community composition in different tree species and different boxes. (left) Heatmap representing the most abundant EMF in all saplings across boxes and species: Pinus halepensis, Cupressus sempervirens, Quercus calliprinos, Pistacia lentiscus and Ceratonia siliqua. Saplings identities are indicated in the y‐axis by species and individual number. NMDS plot representing the distance of each tree's fungal communities among abundant mycorrhiza across (top right) species (r 2 = 18%) and across (bottom right) boxes (r 2 = 10%). Ellipses show the multivariate normal distribution with 95% confidence level. NMDS stress level is 0.18
