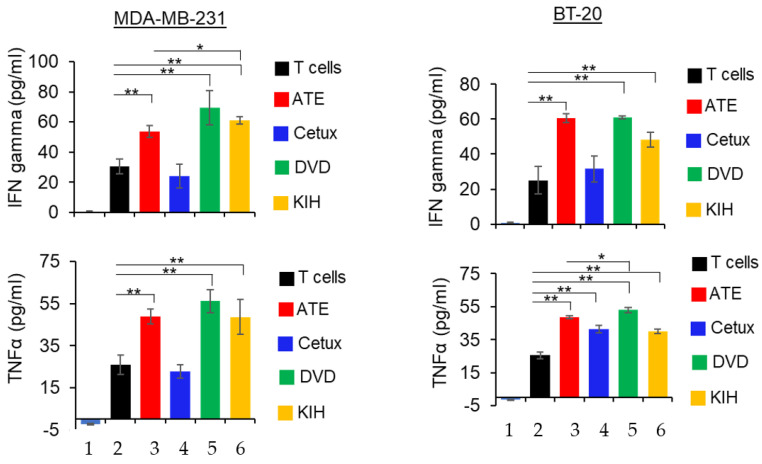
Figure 6.
Detection of IFNγ and TNFα in co-culture of cancer cells and T cells in presence of parental mAbs and BsAbs. After 24 h of incubation, the supernatant was collected and then subjected to ELISA assay kit (R and D systems) to detect IFNγ and TNFα. Bar# 1 of each bar graph represents tumor cells only. Bar# 2,3,4,5,6 of each bar graph represents tumor cells co-cultured with T cells. Bar# 3,4,5,6 represents antibody treatments indicated in color codes. This experiment has been performed in biological triplicates, and data are representative of two or more independent experiments. The differences between two groups were considered statistically significant when p < 0.05 (*, p < 0.05; **, p < 0.01).

