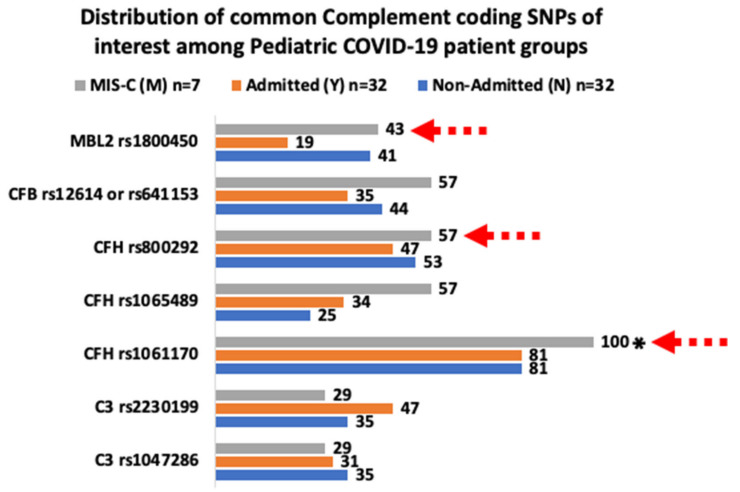
Figure 2.
The graph visualizes the data derived from Table 2 and Table 3. The red dashed arrows indicate the most striking differences observed for the frequencies of CFB rs12614, rs641153, and CFH rs1061170, rs1065489 among the pediatric COVID-19 patient groups examined. * p = 0.007 for the comparison between the MIS-C and non-MIS-C patients as shown in Table 2.

