Figure 1.
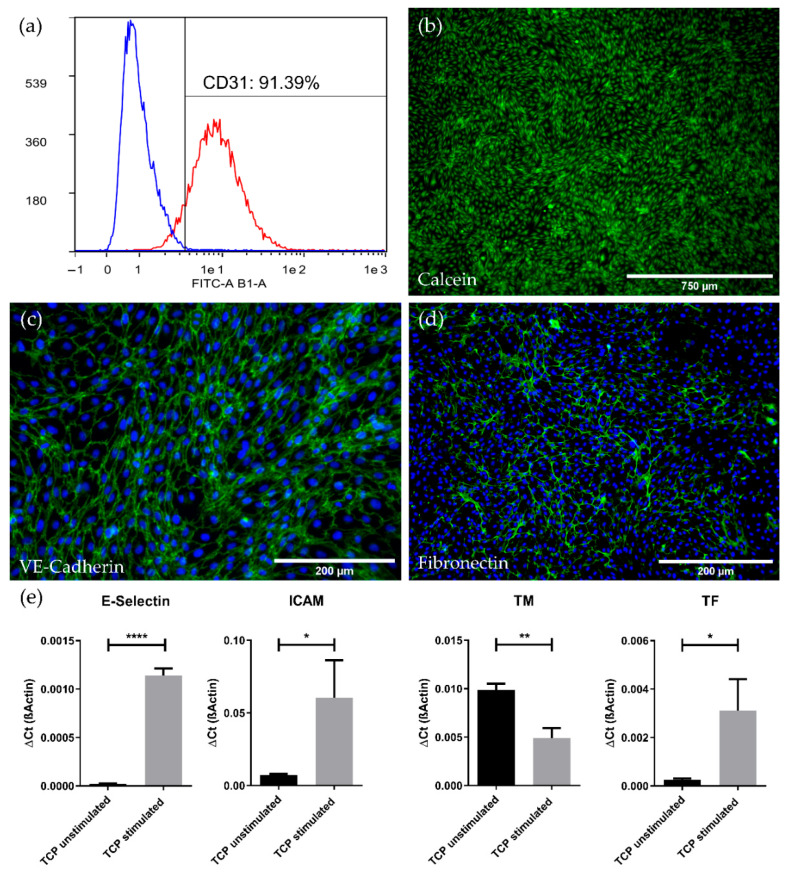
Characterization of isolated pCECs. (a) Histogram view of cultured pCECs, analyzed via flow cytometry for the expression of CD31 (red) versus the IgG control (blue); (b) Calcein staining (green) of the confluent and viable pCECs monolayer on TCP with a characteristic cobblestone morphology; Immunofluorescence microscopy of pCECs on TCP for the detection of (c) the EC-specific junction protein VE-Cadherin (green) and (d) the extracellular matrix protein fibronectin (green); (c,d) Corresponding nuclei were counterstained with Hoechst 33342 (blue); (e) Real-time qRT-PCR expression analysis of inflammatory (E-Selectin and ICAM) and thrombogenic state (TM and TF) marker genes with and without TNFα stimulation. Gene expression levels of the stimulated group were compared to its respective unstimulated control group using an unpaired t-test. TCP: Tissue Culture Plastic; stimulated: six hours TNFα exposure; unstimulated: control group without TNFα exposure. Results are given as mean with SD (n = 3) (* p < 0.05; ** p < 0.01; **** p < 0.0001).

