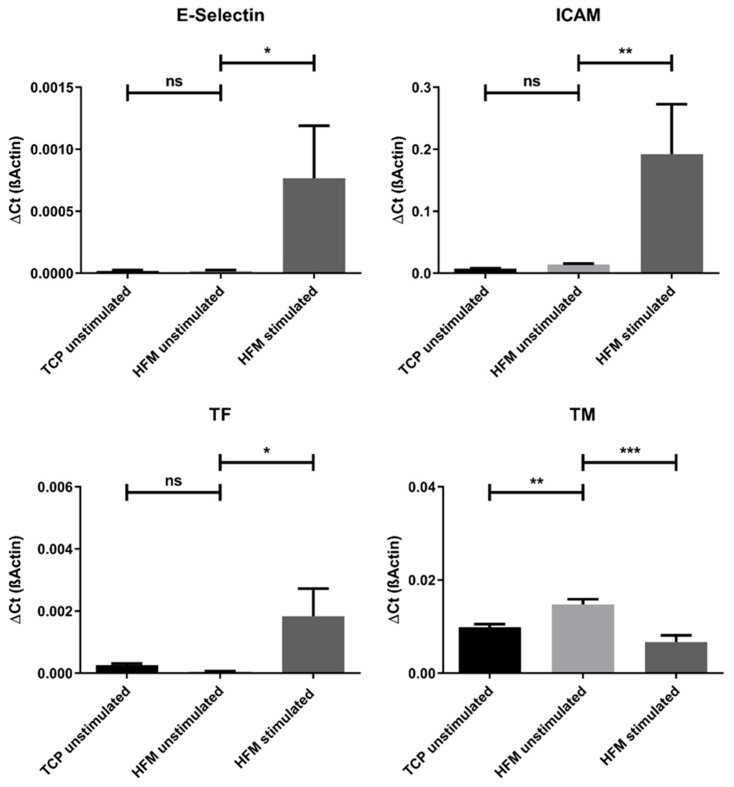
Figure 3.
Gene expression analysis for the assessment of the inflammatory and thrombogenic genotype of pCECs on HFMs. Expression levels of the inflammatory (E-Selectin and ICAM) and thrombogenic state (TM and TF) marker genes were compared between untreated pCECs on TCP versus HFMs and pCECs on HFMs stimulated with TNFα. A one-way ANOVA with correction for multiple comparisons (Šídák test) was used to compare these three groups as indicated in the figure. TCP: Tissue Culture Plastic; HFM: Hollow Fiber Membrane; stimulated: six hours of TNFα exposure; unstimulated: control group without TNFα exposure. Results are given as mean with SD (n = 3) (* p < 0.05; ** p < 0.01; *** p < 0.001; ns = no significance).

