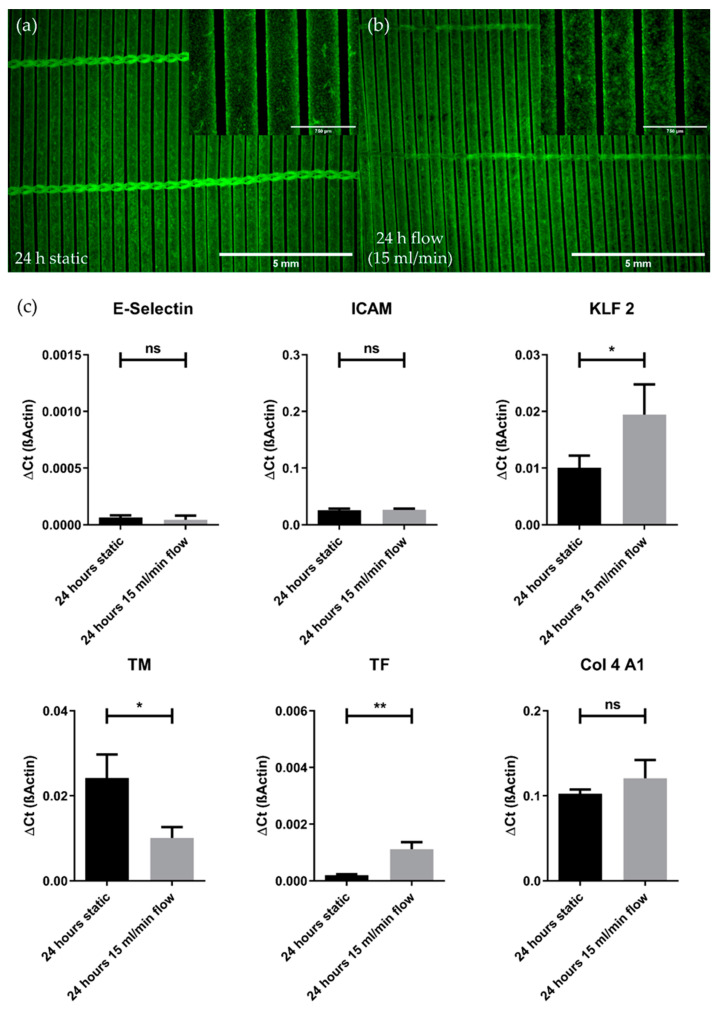
Figure 4.
Comparison of pCECs under static and flow conditions. (a,b) Calcein staining of viable pCECs (green) after 24 h of static (a) or dynamic (15 mL/min flow) (b) conditions; (c) qRT-PCR analysis of flow-exposed pCECs regarding inflammatory activation (E-Selectin and ICAM), shear stress response (KLF 2), thrombogenic state (TM and TF) and matrix synthesis (Col 4 A1). Gene expression levels of the flow-exposed group were compared to the static control groups using an unpaired t-test. For abbreviations of gene names, see Table 2. Results are given as mean with SD (n = 3) (* p < 0.05; ** p < 0.01; ns = no significance).

