Figure 6.
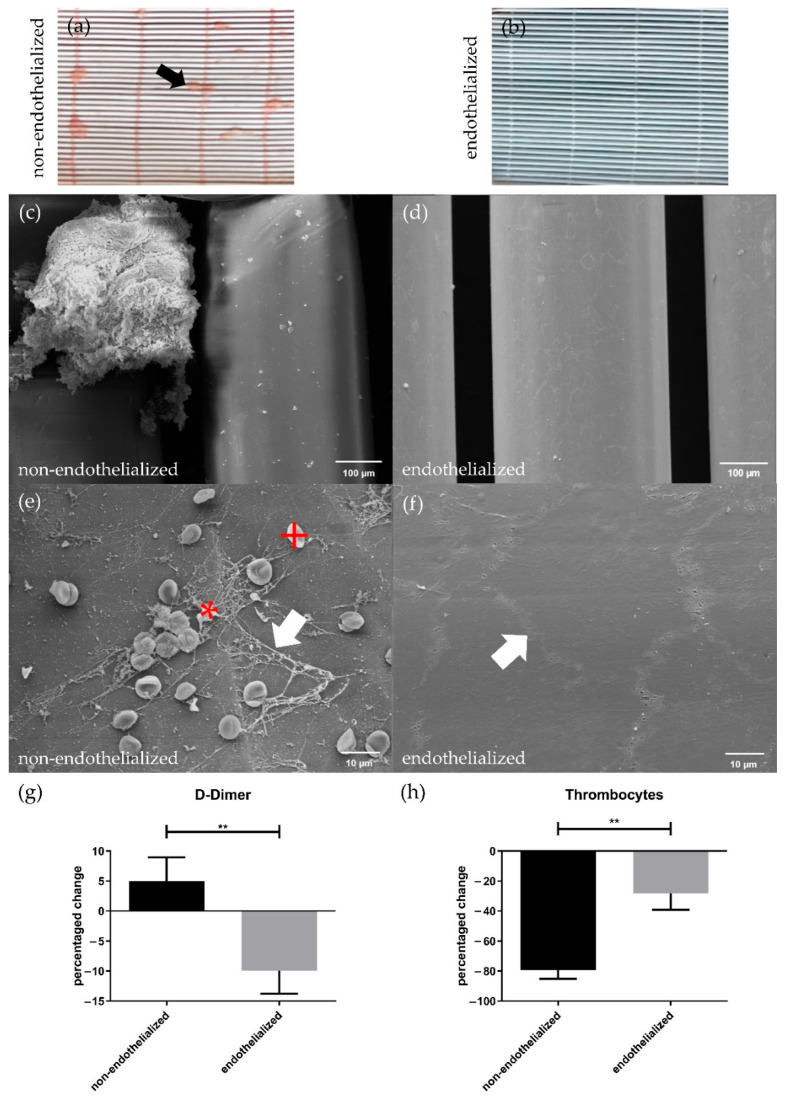
Thrombogenicity assessment of HFMs with and without pCEC monolayer after blood flow exposure. Macroscopic examination of (a) non-endothelialized and (b) endothelialized HFMs; (a) black arrow = macroscopically visible thrombus; SEM images of (c,e) non-endothelialized and (d,f) endothelialized HFMs; (e) white arrow: fibrin, red +: erythrocyte, red *: thrombocyte; (f) white arrow: cell-cell contact within confluent EC-monolayer; (g) D-Dimer and (h) thrombocyte count level changes in the non-endothelialized and endothelialized HFM group before and after blood flow exposure. An unpaired t-test was used to compare both groups. Results are given in mean difference [%] with SD (n = 3) (** p < 0.01).

