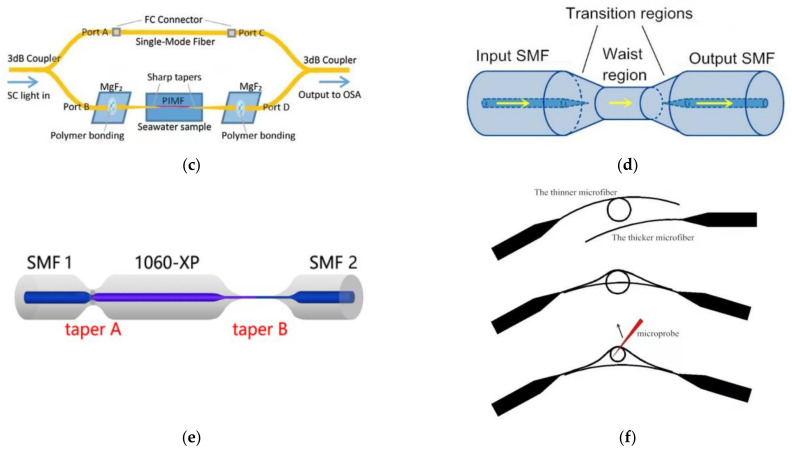
Figure 4.
Schematic diagram of (a) the sensor [98] and (b) experiment setup [99] for the measurement of TS in seawater by OMC. (c) Schematic diagram of the hybrid MZI [102]. (d) Schematic diagrams of tapered fiber structure [103]. (e) Combining the in-line MMZI with tapered SF or Sagnac loop [104]. (f) The fabrication process of a microfiber MZ interferometer with a knot resonator structure [106]. Reprinted with permission from Ref. [106]. Copyright 2016 IEEE.


