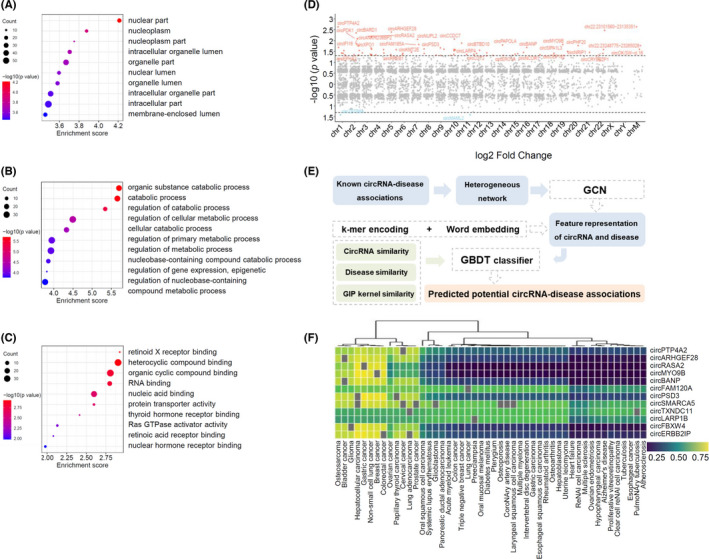
FIGURE 2.

Functional prediction of differentially expressed circRNAs by GO analysis, chromosome location, and online database. (A–C) Gene ontology analysis of selected circRNAs, including cellular component (A), biological process (B), and molecular function (C). Term is the functional description information of GO and count is the number of genes associated with the listed terms. Dot plot shows the enrichment score values of the top most significant enrichment terms. The p value denotes the significance of GO terms enrichment in the genes. The enrichment score was calculated as ‐log10 (p value). (D) Distribution of significantly differentially expressed circRNAs in human chromosomes. (E) Schematic of circRNA‐disease associations prediction by CircDis trained on CircR2Disease v2.0. GCN is used to extract circRNA features and disease features from known circRNA‐disease associations. k‐mer encoding and word embedding help workout feature representation of circRNAs and diseases. Then, circRNA functional similarity, disease similarity, and GIP kernel for circRNAs and diseases are calculated respectively. And GBDT classifier is applied to predict the potential circRNA‐disease associations. GBDT, gradient boosting decision tree; GCN, graph convolutional network; GIP, Gaussian interaction profile. (F) CircRNA‐disease associations predicted by CircR2Disease v2.0. Twelve upregulated circRNAs are predicted to associate with 48 diseases based on CircDis model, with circRNA‐disease association score ranging from 0 to 1 (significant with score >.5; insignificant otherwise)
