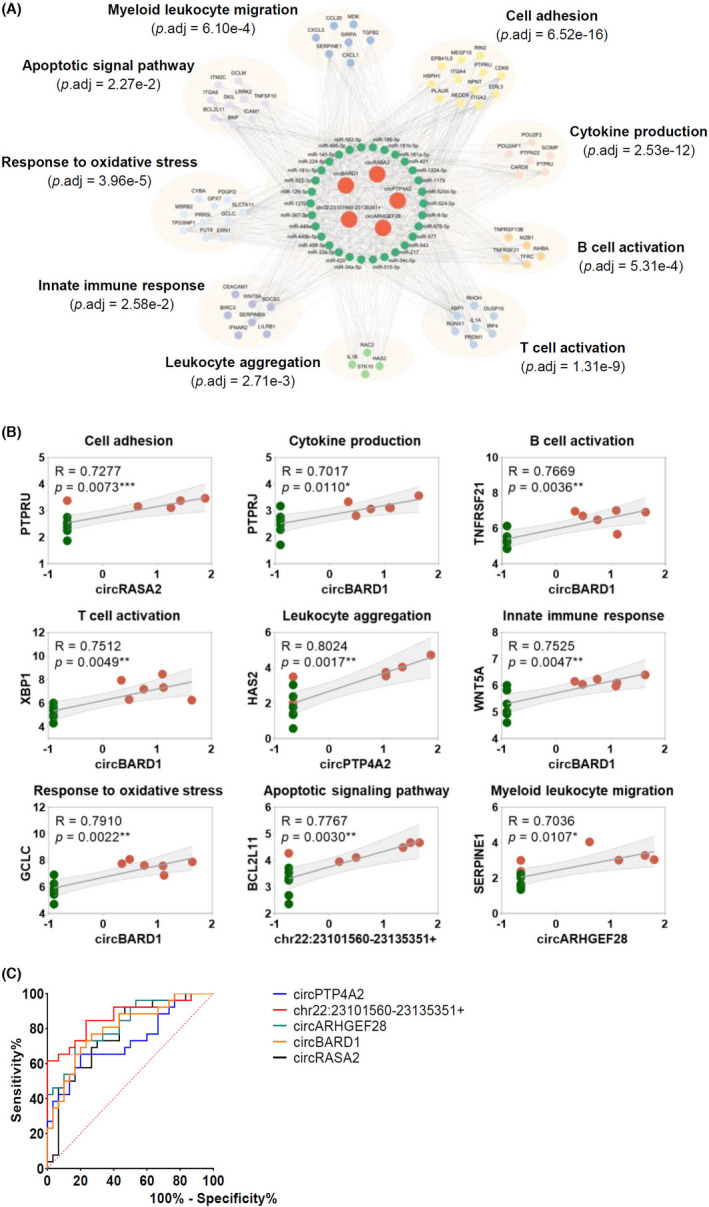
FIGURE 6.

Construction of circRNA‐miRNA‐mRNA network and ROC analysis of identified upregulated circRNAs. (A) CircRNA‐miRNA‐mRNA network analysis for the five upregulated circRNAs and differentially expressed mRNAs. (B) Correlations between the five upregulated circRNAs expression and 9 mRNAs expression in high‐throughput sequencing were analyzed by Spearman's correlation analysis. The 9 mRNAs were selected as representatives for nine clusters of circRNA network. p < .05 was considered statistically significant. (C) ROC curves of identified circRNAs in gingival tissues from patients with periodontitis. The largest AUC was demonstrated for chr22:23101560‐23135351+ (0.8667), followed by circARHGEF28 (0.8244), circBARD1 (0.8013), circRASA2 (0.7731), and circPTP4A2 (0.7321). y‐axis indicates the true positive rate of the risk prediction. x‐axis indicates the false‐positive rate of the risk
