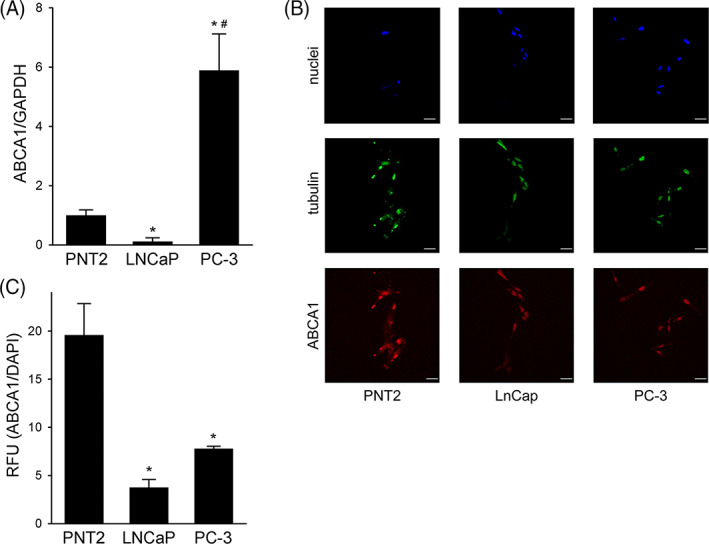
FIGURE 4.

ABCA1 levels in PNT2, LNCaP, and PC3 cells; Panel A, ABCA1 mRNA levels by real‐time PCR. Data are expressed as mean ± SD, n = 3. *p < 0.05 versus PNT2, #p < 0.05 versus LNCaP. Panel B, Representative confocal immunofluorescence images for ABCA1 (red), tubulin (green), and DAPI (blue). Cells were fixed with 4% paraformaldehyde. Scale bar, 50 μm. Panel C, Quantitative assessment of ABCA1 fluorescence intensities. Data are expressed as ABCA1/DAPI signal ratio, mean ± SD, n = 3. *p < 0.05 versus PNT2
