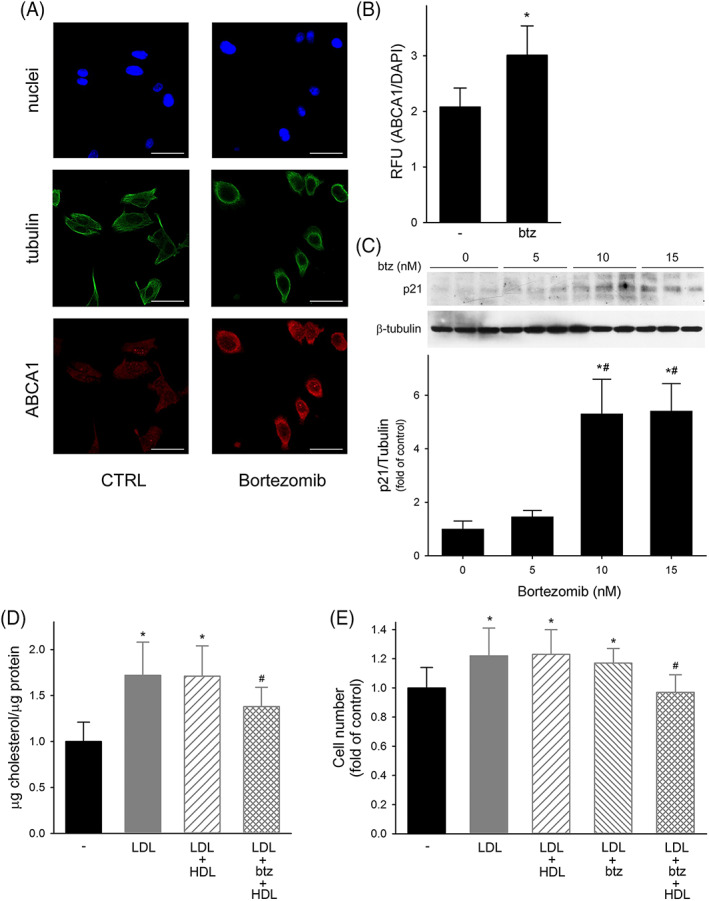
FIGURE 5.

Effect of bortezomib on ABCA1 expression, cholesterol content, and proliferation in PC3 cells; Panel A, Representative confocal immunofluorescence images for ABCA1 (red), tubulin (green), and DAPI (blue). Scale bar, 50 μm. Panel B, Quantitative assessment of ABCA1 fluorescence intensities in untreated cells (−) and in cells incubated with 5 nM bortezomib (btz). Data are expressed as ABCA1/DAPI signal ratio, mean ± SD, n = 3. *p < 0.05 versus untreated cells. Panel C, Expression of p21 by Western blotting in PC3 cells incubated with increasing concentrations of bortezomib. Data are expressed as fold increase of untreated cells, n = 3. *p < 0.05 versus control, #p < 0.05 versus bortezomib 5 nm. Panel D, Cholesterol content in untreated cells (black bars), or in cells incubated with (A) LDL at 50 μg/ml for 24 h (gray bars), (B) LDL at 50 μg/ml for 24 h followed by HDL at 0.5 mg/ml for 1 h (gray dashed bars), or (C) LDL at 50 μg/ml plus bortezomib (btz) 5 nM for 24 h, followed by HDL at 0.5 mg/ml for 1 h (gray crossed bars). Data are expressed as mean ± SD, n = 9. *p < 0.05 versus untreated cells, #p < 0.05 versus LDL. Panel E, Cell proliferation evaluated as cell number at 72 h in untreated cells (black bars) or in cells incubated with (A) LDL at 20 μg/ml for 24 h (gray bars), (B) LDL at 20 μg/ml for the first 24 h followed by HDL at 0.5 mg/ml for 48 h (gray dashed bars), (C) LDL at 20 μg/ml plus bortezomib 5 nM for 24 h followed (gray crossed bars) or not (gray dashed bars) by HDL at 0.5 mg/ml for 48 h
