
FIGURE 5.
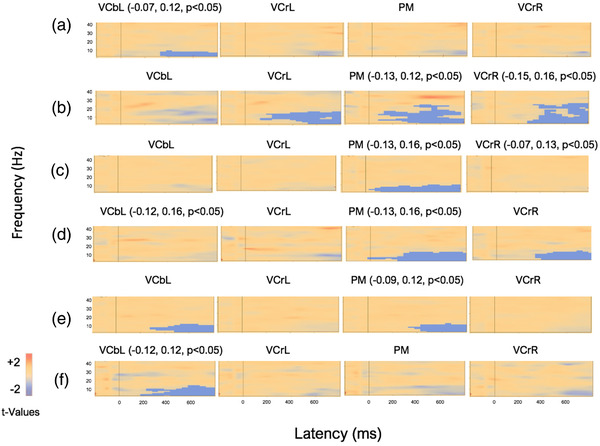
Average visualization of significant data clusters in the visual sources of interest when the combined motion condition was compared with the static condition in extrastimulated infants (a and d), control infants (b and e), and preterm infants (c and f) at the first and second session, respectively. Light blue colors represent negative clusters (i.e., combined motion condition had smaller t‐values than static control condition) and positive clusters are marked with light red colors (i.e., motion condition had larger t‐values than static condition). Significant negative clusters in the visual areas of interest (VCbL, VCrL, PM, VCrR) are marked with light blue voxel marks. Vertical line marks stimulus onset, and epoch is from −200 to 800 ms. Each visual area is dominated by activity in the theta‐band, but over longer periods of time and more prevalent when infants in all groups were younger. The results showed that theta‐band activity was more prevalent and widespread in the first session for control infants compared with both extrastimulated and preterm infants. However, preterm infants showed more widespread theta‐activity compared with extrastimulated and control infants in the second session