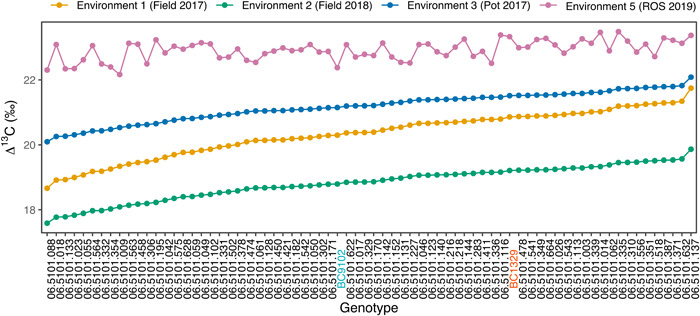
Figure 4.

Reaction norm and phenotypic variation in Δ13C (‰) among a subset of 70 DH lines and the parental lines evaluated under different environments (Experiments 1–3, 5). CGE EBLUPs for Experiments 1–3 and genotype EBLUPs for Experiment 5 are plotted to show the change in scale and ranks. Genotypes are ordered based on the ranks for Environment 1. DH, doubled haploid; EBLUP, empirical best linear unbiased predictions; CGE, common genotype by environment.
