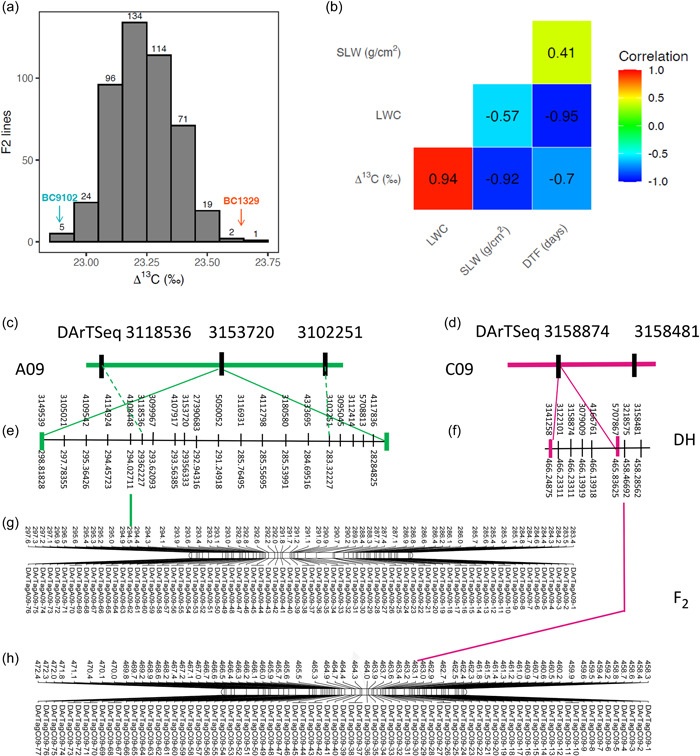
Figure 5.

Validation of the genetic linkage between Δ13C and molecular markers in an F2 validation population derived from the BC1329/BC9102, grown under non‐stress conditions (Experiment 4). The frequency distribution of Δ13C (‰) among 733 F2 lines (a). Genetic correlations between Δ13C, DTF, LWC, and SLW from bivariate analyses are shown (b). The genetic position of flanking markers for Δ13C QTL on A09 (c) and C09 (d) and their corresponding physical positions (e, f) in the DH population and physical map positions of DArTseq markers on A09 and C09 chromosomes in an F2 population. (g, h) Comparative physical locations of markers are shown with lines (in colour). For clarity, physical positions are given in 1/10th fraction of Mb. DH, doubled haploid; DTF, days to flower; LWC, leaf‐water content; QTL, quantitative trait loci; SLW, specific leaf weight; Δ13C, carbon isotope discrimination.
