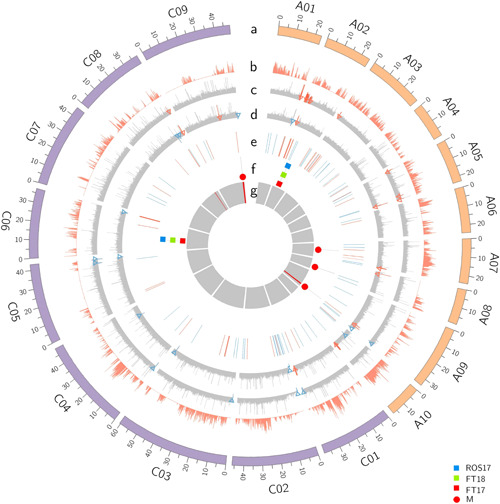
Figure 7.

Physical map positions of QTL controlling Δ13C variation in a doubled haploid population derived from the BC1329/BC9102. a: the outermost circle represents the physical length of the chromosomes (A genome in orange, C genome in purple), b: polymorphic SNPs between BC1329 and BC9102, c: homoeologous exchanges identified in BC1329, d: homoeologous exchanges identified in BC9102, e: DEGs identified between BC1329 and BC9102 (under dry and wet conditions), f: QTL associated with Δ13C variation; blue, green and red, g: DEGs located within QTL regions. DEG, differentially expressed gene; QTL, quantitative trait loci; SNP, single nucleotide polymorphism.
