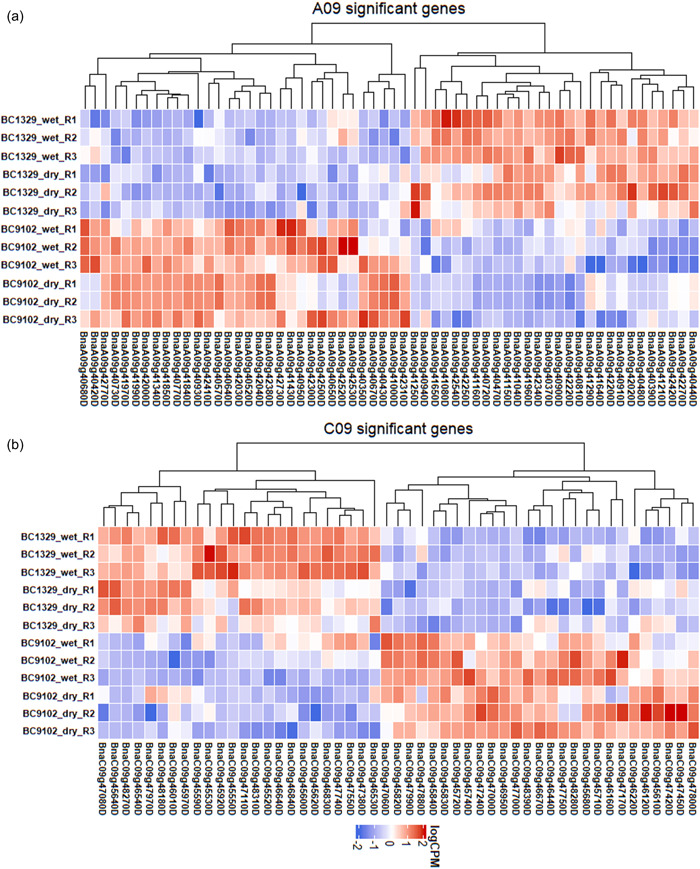
Figure 8.

Expression profiles of differentially expressed genes (DEGs) in A09 (a) and C09 (b) QTL regions under water‐deficit and water non‐deficit conditions (Experiment 6) of the parental lines of the doubled haploid population derived from the BC1329/BC9102. The normalized read counts were plotted as a heatmap and genes were clustered according to the basis of their expression pattern. Detailed information on DEGs of parental lines (in triplicate: R1, R2, and R3) is presented in Supporting Information: Table S11. QTL, quantitative trait loci.
