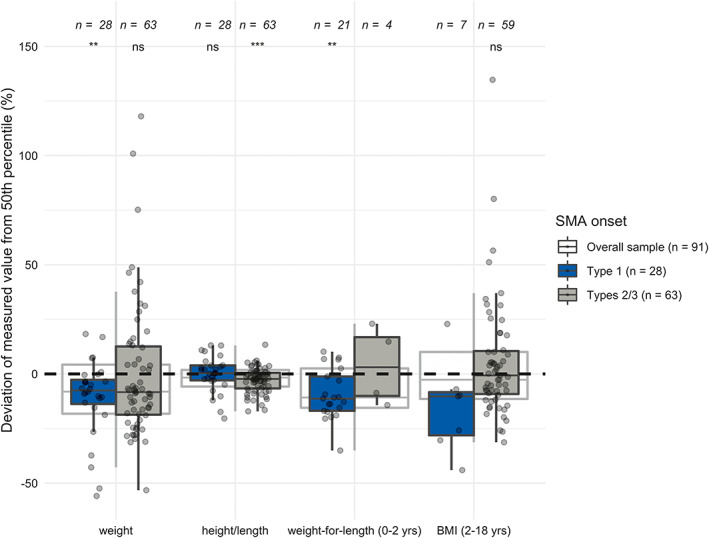
FIGURE 1.

Deviations of measured weight, height/length, weight‐for‐length (0–2 y), and BMI‐for‐age (2–18 y) in percent from the 50th percentiles in the overall sample, patients with type 1 SMA and patients with types 2/3 SMA

Deviations of measured weight, height/length, weight‐for‐length (0–2 y), and BMI‐for‐age (2–18 y) in percent from the 50th percentiles in the overall sample, patients with type 1 SMA and patients with types 2/3 SMA