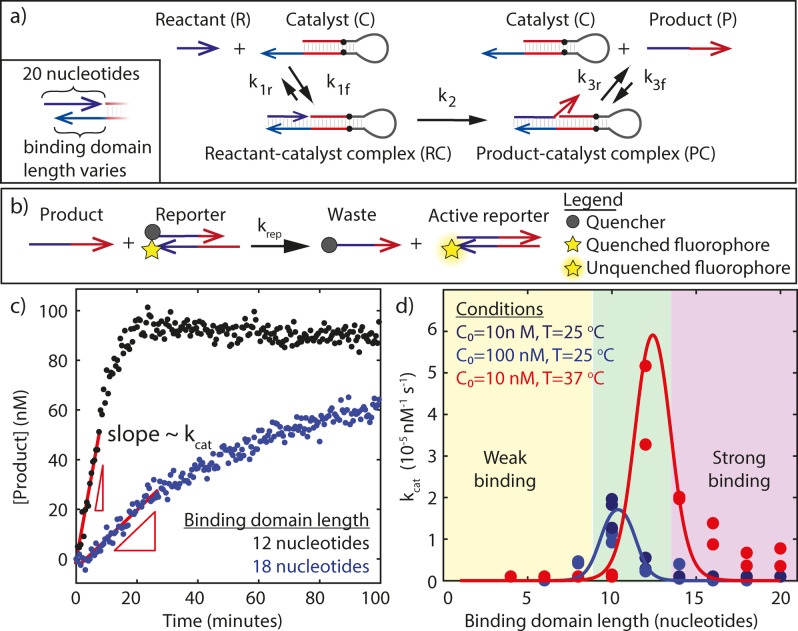
Figure 2.
a) Overview of the PER reaction. The reactant or primer (blue) is a 20 nucleotide single‐stranded DNA. It binds to the blue single‐stranded binding domain on the catalytic hairpin. This binding domain can vary in length from 4 to 20 nucleotides. Black dots represent a stop sequence for DNA polymerase. Dark and light red and dark and light blue strands each have complementary sequences. b) Reporting scheme for measuring the output of PER. The PER product reacts with the reporter via a 6 nucleotide toehold strand‐displacement reaction. This reaction separates the quencher‐labeled strand from the fluorophore‐labeled strand in the reporter complex and produces a fluorescent signal proportional to the product strand concentration. c) Measured PER product concentration as a function of time. The turnover frequency k cat was determined by dividing the initial slope by R 0 and C 0. The experiment was conducted at 37 °C using catalyst hairpins with binding domains 12 (black) and 18 (blue) nucleotides in length. Both binding domains only contained A's and T's. C 0=10 nM and R 0=100 nM. d) The turnover frequency k cat as a function of binding domain length for a range of experimental conditions. Dark and light blue dots represent experiments conducted at 25 °C and red dots represent experiments conducted at 37 °C. C 0=10 nM in all experiments except the light blue ones, where C 0=100 nM. R 0 is either 100 nM or 200 nM (see Supplementary Methods for details). The curves represent fits of Equation (3) to the data with k 2 as the only adjustable parameter. We find that k 2≈0.002 at 25 °C and k 2≈0.008 at 37 °C. In the model we use R 0=100 nM.

