Figure 5.

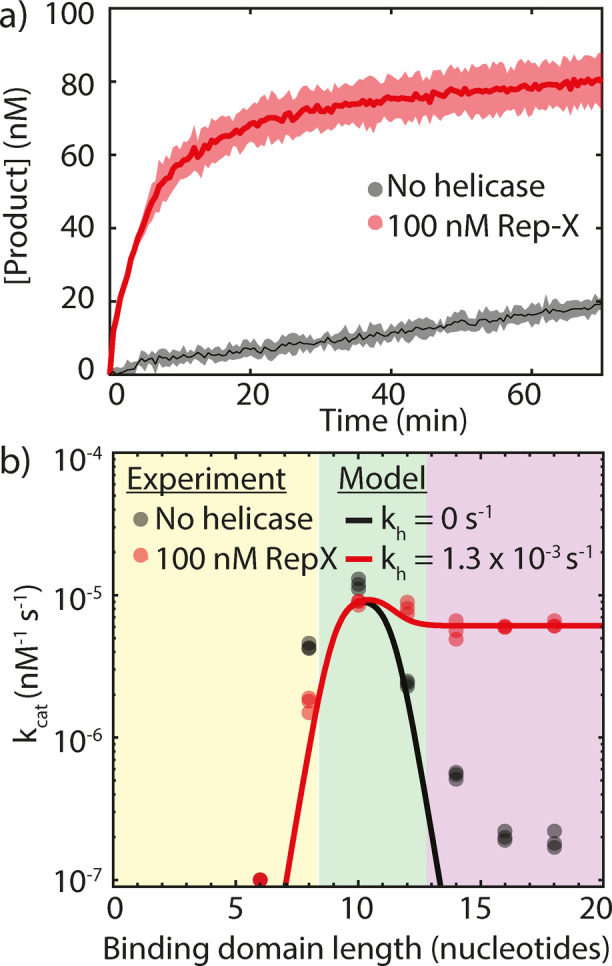
a) Product concentration increase over time in PER reactions with a binding domain length of 16 nucleotides. The black line depicts the average of three experiments in the absence of helicase. The red line depicts the average of three samples containing 100 nM Rep‐X helicase and 1 mm ATP. Shaded areas indicate the standard deviation. In both experiments C 0=100 nM and R 0=200 nM. b) The turnover frequency k cat is plotted versus the binding domain length on a semilog plot, resulting in the classical volcano plot. Curves represent the predictions from Equation (3) and (6). The black curve is a fit to the data in absence of helicase with the only adjustable parameter k 2=2×10⁻³. The red curve is a fit to the data in presence of helicase using k 2=2×10⁻³ with k h=1.3×10⁻³ and L=0.1 as the only adjustable parameters. Data points represent individual experiments. Each experiment is done in triplicate.
