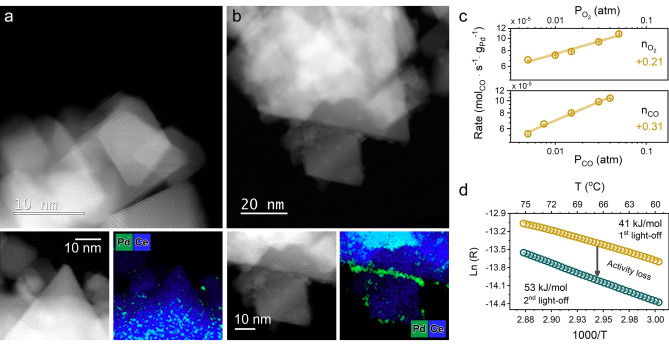
Figure 1.
Structure and activity of Pd/CeO2 catalyst. HAADF‐STEM and EDX mapping of fresh Pd/CeO2 catalyst: a) region with highly‐dispersed Pd species; b) region with small clusters and nanoparticles of Pd oxide. c) Steady‐state catalytic activity of the Pd/CeO2 in CO oxidation as a function of pressure of reactants at 80 °C. GHSV≈240 000 mL gcat −1 h−1 , conversion kept below 5 %. Error bars represent five consequent measurements. d) Arrhenius plot for low‐temperature catalytic activity of Pd/CeO2 in CO oxidation. Yellow circles represent the first light‐off run (RT to 300 °C), cyan circles stand for the second run. Reaction conditions: 1 % CO and 1 % O2 in He (GHSV≈180 000 mL gcat −1 h−1), conversion kept below 10 %.

