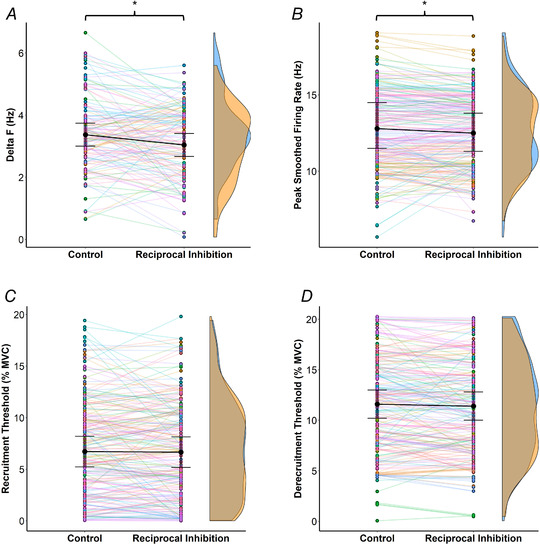
Figure 2. Data from the paired motor unit technique in control and reciprocal inhibition (common peroneal nerve stimulation) trials.

The different panels illustrate the changes in ΔF of individual test units (A, n = 130), peak smoothed firing rate (B), recruitment (C) and derecruitment thresholds (D) of individual motor units (n = 221) from control to reciprocal inhibition. Each pair of points represents an individual test unit (A) or motor unit (B, C, D), whilst each colour refers to one participant. Estimated marginal means are represented by black circles, with 95% confidence intervals indicated. Kernel density estimation (density curves) of the data is represented on the right by half‐violin plots (blue for control and orange for reciprocal inhibition). The peak, valleys, and tails of the density curves can be visually compared to see where control and reciprocal inhibition trials were similar or different. When considering all participants, the repeated measures nested linear mixed‐effects models revealed a significant (* P < 0.05) decrease in ΔF and peak smoothed firing rate from control to reciprocal inhibition. Consideration of significant interactions revealed that the decrease in peak smoothed firing rate was only observed in females, and that recruitment and derecruitment thresholds were significantly reduced in males. [Colour figure can be viewed at wileyonlinelibrary.com]
