
FIGURE 3.
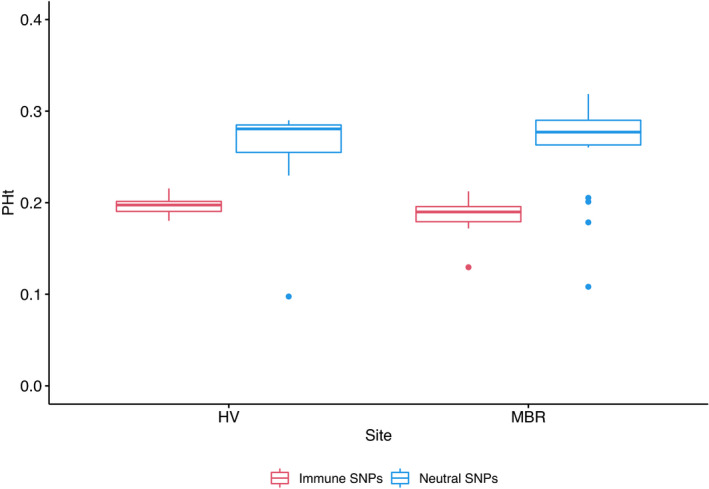
Boxplot displaying the proportion of heterozygotes (PHt) at Hidden Vale and Moreton Bay determined from immune gene SNPs (red) and genome‐wide neutral SNPs (blue). Whiskers mark the “minimum” (1Q − 1.5 × IQR) and “maximum” (3Q + 1.5 × IQR), with outliers shown as dots