FIGURE 5.

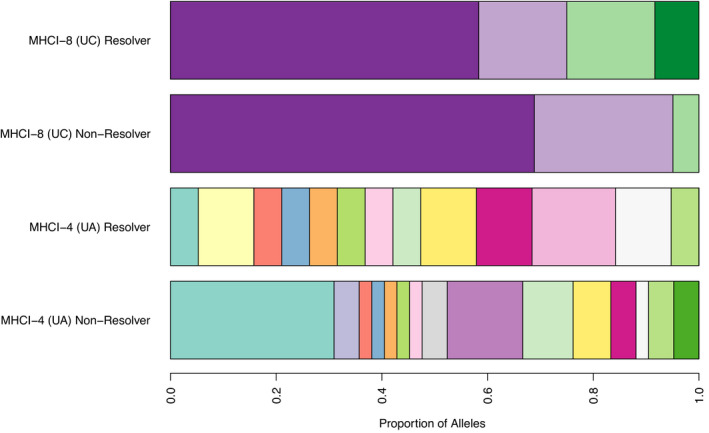
Bar plot representing the differences in proportion of each allele present between koalas that resolved a Chlamydia infection and koalas that did not resolve an infection in the genes UA and UC

Bar plot representing the differences in proportion of each allele present between koalas that resolved a Chlamydia infection and koalas that did not resolve an infection in the genes UA and UC