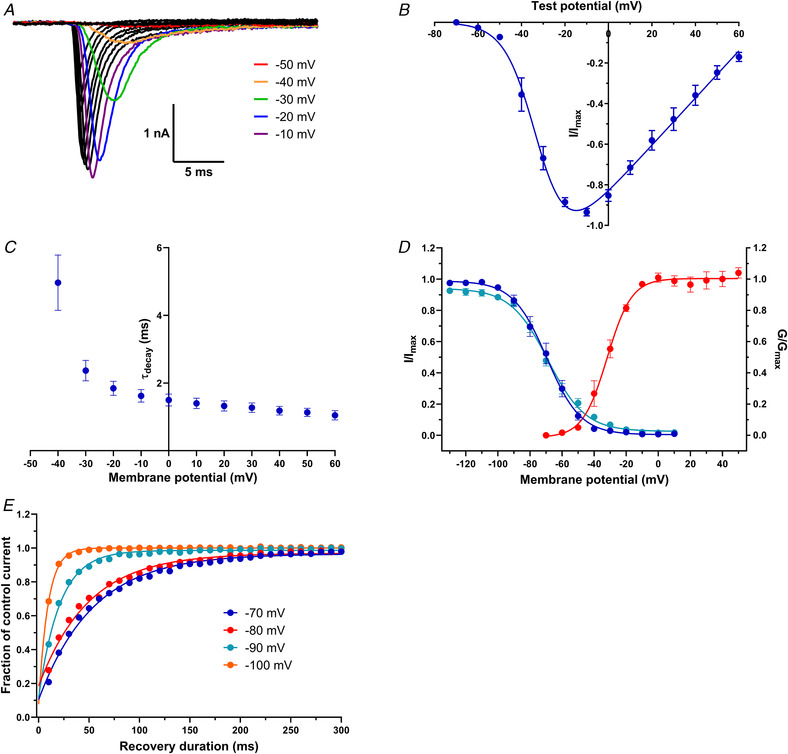
Figure 3. Properties of the voltage‐gated sodium currents elicited in TE671 cells.

A, family of inward currents in response to 25 ms depolarising test potentials from −70 to +60 mV in 10 mV increments. The holding potential was −80 mV. Currents in response to −50, −40 −30, −20 and −10 mV are highlighted in red, orange, green, blue and purple, respectively. B, normalised peak current–voltage relationship for test potentials ranging from −70 to +60 mV. Points are mean fraction of maximum current ± SEM fitted by eqn (1) (n = 25). C, mean current decay time constants ± SEM plotted as a function of membrane potential (n = 11). D, conductance–voltage relationship for activation (red circles, n = 25), voltage dependence of the fast steady‐state inactivation (blue circles, n = 16) and voltage dependence of the slow steady‐state inactivation (turquoise circles, n = 26). Points are mean fractional conductance or current ± SEM and fitted by eqn (3) or (5). E, time dependence of recovery from fast inactivation upon repolarisation to −70, −80, −90 or −100 mV. Points are mean fraction of control current; n > 20 for each data point. [Colour figure can be viewed at wileyonlinelibrary.com]
