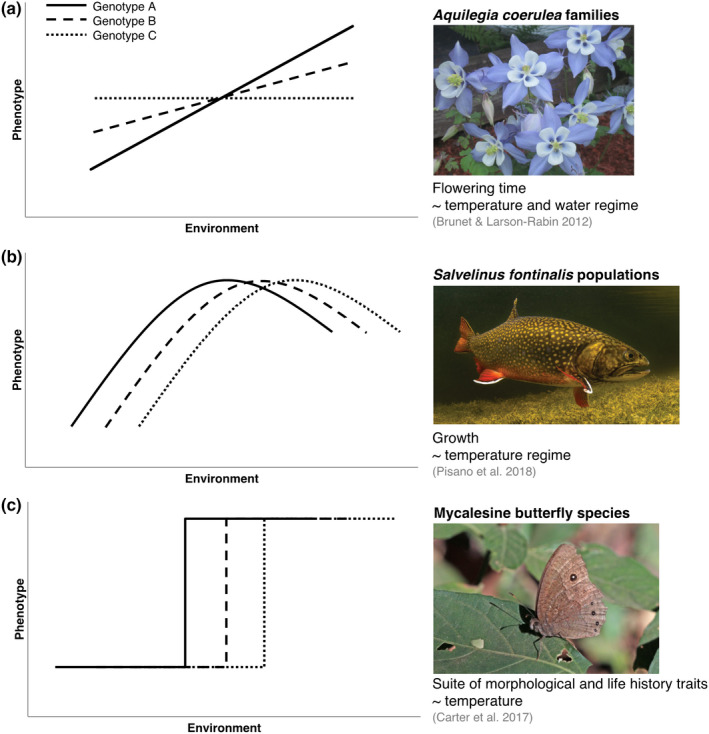
FIGURE 1.

Hypothetical reaction norm variation for three ‘genotypes’ (i.e. families, populations or species) for (a) linear, (b) quadratic and (c) threshold shapes. The examples reflect a variety of organisms, phenotypes and levels of biological organization for which reaction norms are constructed. Photo credits (top to bottom): Rob Duvall; Jay Fleming/US Nat'l Park Svc; Charles J. Sharp
