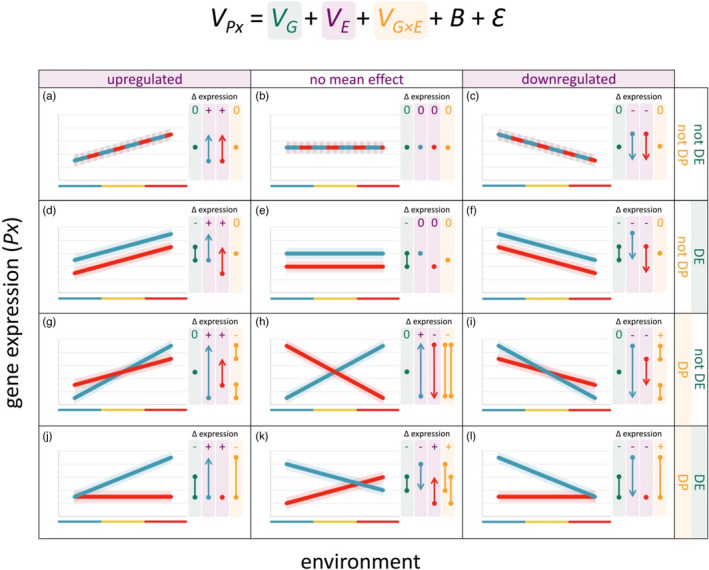
FIGURE 3.

A reaction norm framework for decomposing gene expression (V Px ) differences into overall effects of genotype (V G ; green), environment (V E ; purple) and genotype × environment interaction (V G×E ; orange; Equation 1 fixed effects). For each individual gene, there are 12 categories (a‐l) of gene expression patterns along an environmental gradient. The difference (Δ) in gene expression attributable to each component (i.e. model term) in each category is summarized in terms of direction and relative magnitude compared to the selected model intercept. In this example, the intercept is set to the blue genotype and the blue environment (e.g. the poleward genotype and the lowest temperature; Figure 2). Non‐zero differences in overall expression are categorized as positive (+) or negative (−) in direction relative to the model intercept. Relative magnitudes of expression differences are reflected in the length of arrows and segments below these signs. Arrows represent purely environmental effects (V E ), which are described as up‐ or downregulated along an environmental gradient, separately for each genotype. Segments represent effects with a genetic component (V G and V G×E ). V G is referred to as differentially expressed (DE) between genotypes with respect to mean expression across all environments. V G×E is referred to as differentially plastic (DP) between genotypes with respect to their responses to the environment. If significant overall effects are found, one can conduct post hoc contrasts between specific levels of the factor to determine where the differences lie
