
FIGURE 2.
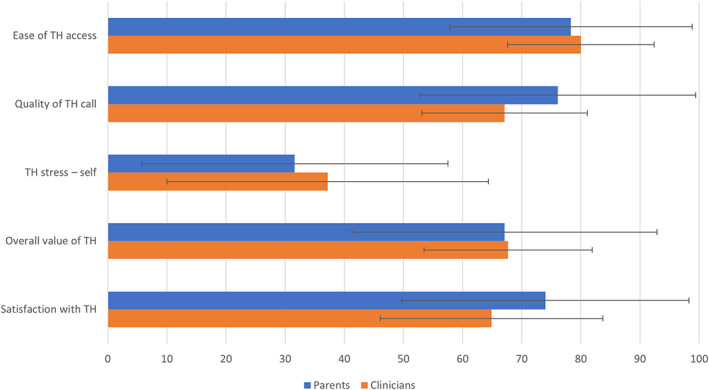
Sliding scale responses (out of 100) for parent/guardian and clinician groups. Mean values with error bars indicating standard deviation. Higher values represent positive findings except for stress where a lower value indicates less stress
Official websites use .gov
A
.gov website belongs to an official
government organization in the United States.
Secure .gov websites use HTTPS
A lock (
) or https:// means you've safely
connected to the .gov website. Share sensitive
information only on official, secure websites.
Sliding scale responses (out of 100) for parent/guardian and clinician groups. Mean values with error bars indicating standard deviation. Higher values represent positive findings except for stress where a lower value indicates less stress