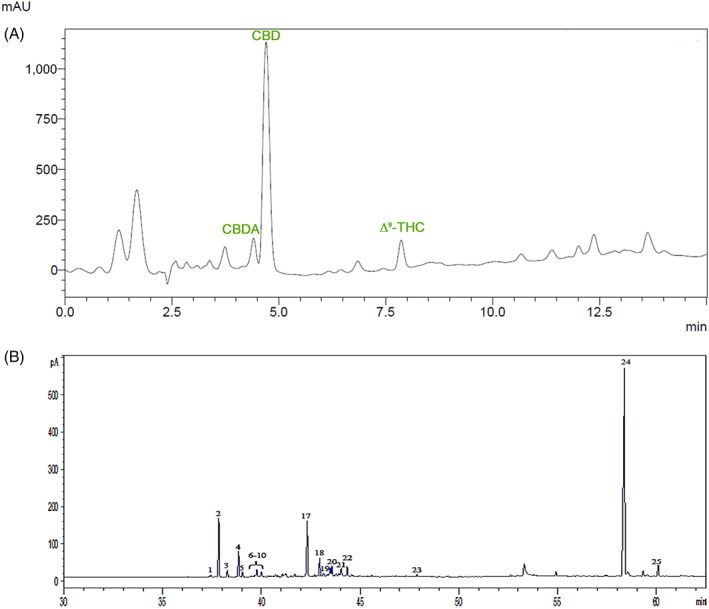
FIGURE 1.

(A) Representative HPLC chromatogram of the Cannabis sativa L. extract recorded at 225 nm, following the method used for the analysis of cannabinoids. CBD, which elutes at 4.4 min, represents the main component. CBDA elutes at 4.2 min. The peak assigned to THC is at 7.4 min. (B) Representative GC chromatogram of the C. sativa L. extract, focused on the retention window of sesquiterpenes and cannabinoids. CBD (peak 24), CAR (peaks 2 and 17), and CBG (peak 25). For peak numbering, see Table S1. CAR, β‐caryophyllene; CBD, cannabidiol; CBDA, Cannabidiolic acid; CBG, Cannabigerol; GC, gas chromatography; THC, Δ9‐tetrahydrocannabinol
