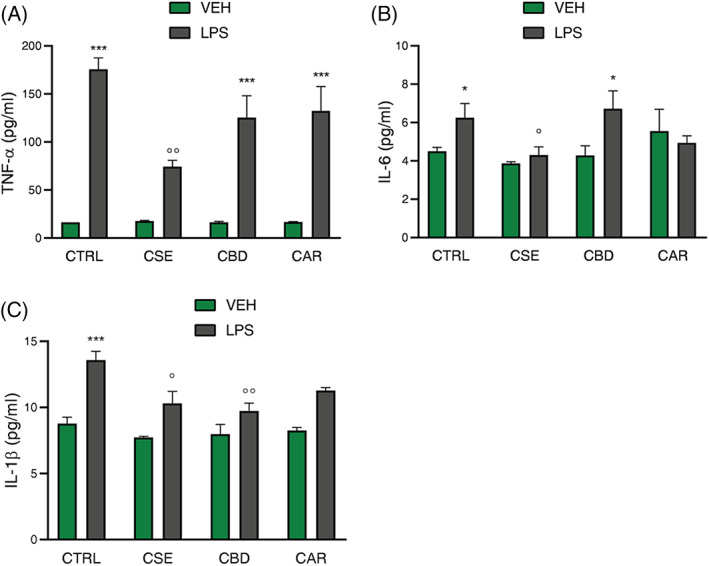
FIGURE 3.

Effect of CSE, CBD, and CAR (1 μg/ml) treatment on TNF‐α (A), IL‐6 (B), and IL‐1β (C) release analyzed by ELISA assay in unstimulated and LPS‐stimulated BV‐2 cells (250 ng/ml). Each column represents mean ± SEM. Data were analyzed by one‐way analysis of variance followed by Tukey: *p < .05,***p < .001 versus CTRL group; °p < .05, °°p < .01 versus LPS (n = 6). CAR, β‐caryophyllene; CBD, cannabidiol; CSE, Cannabis sativa extract; LPS, lipopolysaccharide; SEM, standard error of the mean
