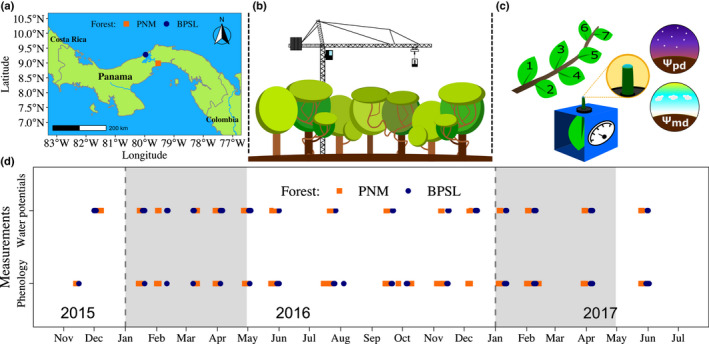
Fig. 1.

Location of the study sites and overview of the study design. (a) The location of the dry Parque Natural Metropolitano (PNM, orange square) and wet Bosque Protector San Lorenzo (BPSL, dark blue circle). (b) Graphical representation of the canopy cranes towering above the forest canopy, which were used at both study sites. (c) Graphical representation of a sample branch, with its leaves numbered, and a pressure chamber used to measure leaf water potential before dawn (predawn; Ψpd) and during the hour following midday (midday; Ψmd) for both lianas and trees in both forests. (d) Plot showing the timing of vegetative phenology and leaf water potential data collection for both lianas and trees from the canopy cranes in PNM (orange squares) and BPSL (dark‐blue circles). Gray shading identifies the January‐to‐April dry season.
