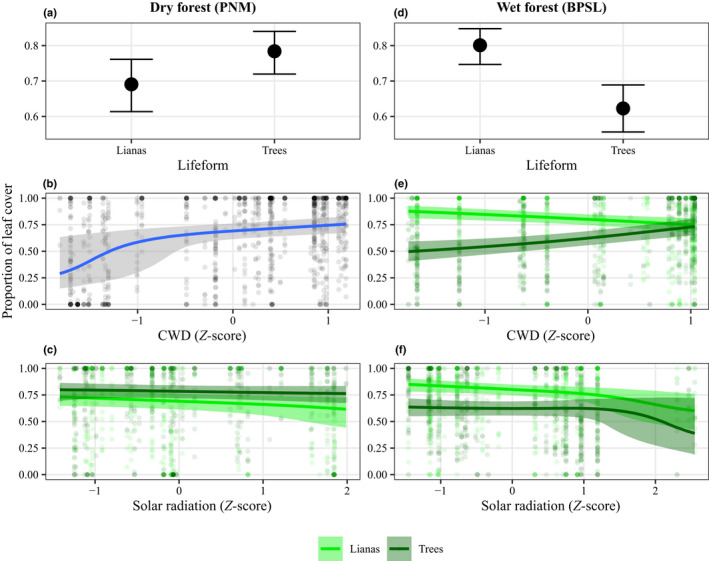
Fig. 5.

Conditional effects of lifeform (i.e. lianas vs trees) (a, d), cumulative water deficit (CWD) (b, e) and solar radiation (c, f) on the proportion of leaf cover of lianas and trees for the dry (PNM; left column) and wet (BPSL; right column) forests. The y‐axes show the predicted proportion of leaf cover. In (a) and (d), the x‐axes represent the levels of the categorical variable ‘lifeform’; in (b) and (e), they represent the (standardized) Z‐score of CWD (mm day−1); and in (c) and (f), they represent the (standardized) Z‐score of solar radiation (MJ m−2 d−1). The conditional effects for each predictor were calculated by setting the other (continuous) predictors to their mean values. The dots in (a) and (d) indicate the predicted median proportion of leaf cover for lianas and trees calculated from the posterior predictive distribution of the best‐fit model. The blue line in (b) indicates the predicted median proportion of leaf cover for both lianas and trees. The light green and dark green lines in (c), (e), and (f) indicate the predicted median proportion of leaf cover for lianas and trees, respectively. The error bars around the predicted median dot in (a) and (d), and the shadow(s) around the predicted median line(s) in (b), (c), (e) and (f) are represent the 89% credible intervals of the median estimate.
