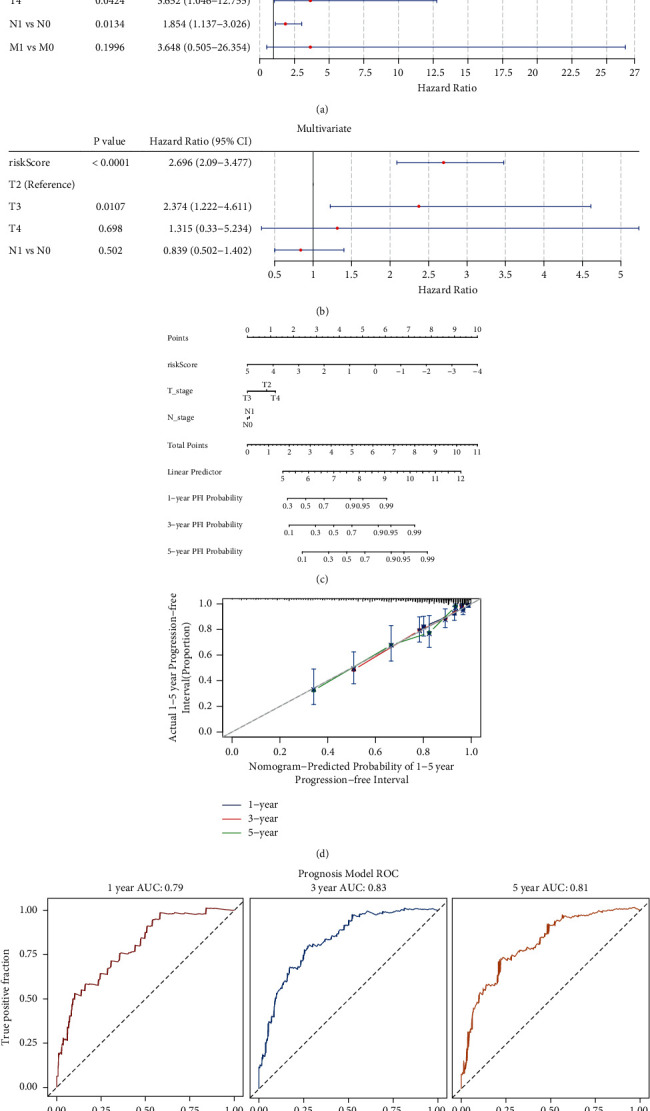
Figure 10.

Establishment of the predictive nomogram. Independent prognostic factor analyzes using (a) univariate and (b) multivariate cox regression. (c) Nomogram based on risk score and T&N stage for the prediction of the 1-, 3- and 5-year progression-free interval (PFI). (d) The calibration curves of the nomograms for the 1-, 3- and 5-year PFI. (e) Receiver operating characteristics curve analysis for the 1-, 3- and 5-year PFI.
