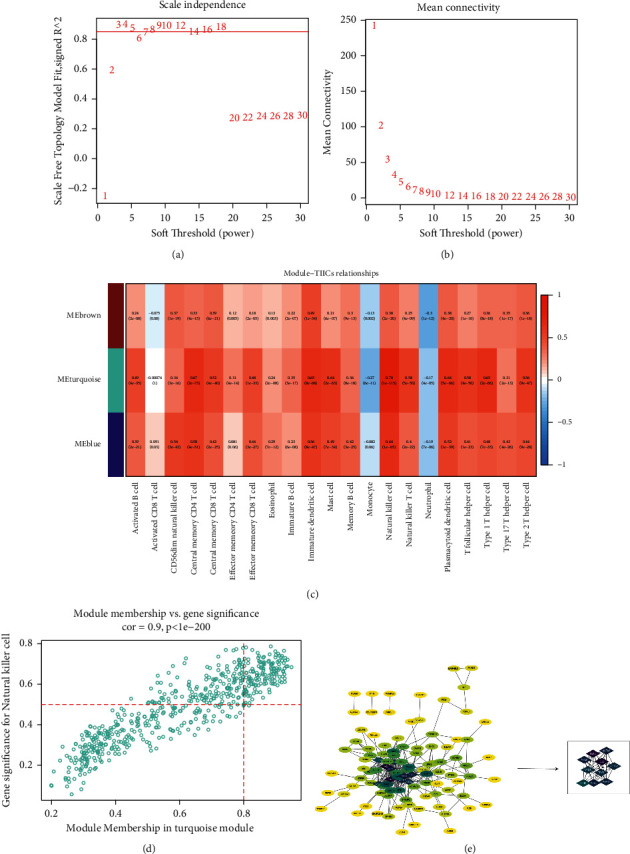
Figure 3.

The selection of hub genes. (a) The nature of the network topology is constructed using the unique soft threshold (Power). (b) The relationship between Soft Threshold (Power) values and mean connectivity. (c) The correlation between the different modules of ME brown, ME turquoise, ME blue, and tumour-infiltrating immune cells. (d) Scatter plot showing the correlation between genes (MM) and natural killer cells (GS) in the turquoise module. The genes meeting the criteria of GS > 0.5 and MM > 0.8 were selected for further analysis. (e) Protein-protein interaction (PPI) networks in 144 genes and the selection of 10 hub genes. The circle indicates genes in the turquoise module while the edges indicate the interactions between genes. The PPI network was constructed using STRING and visualised using the R package “ggcorrplot.”
