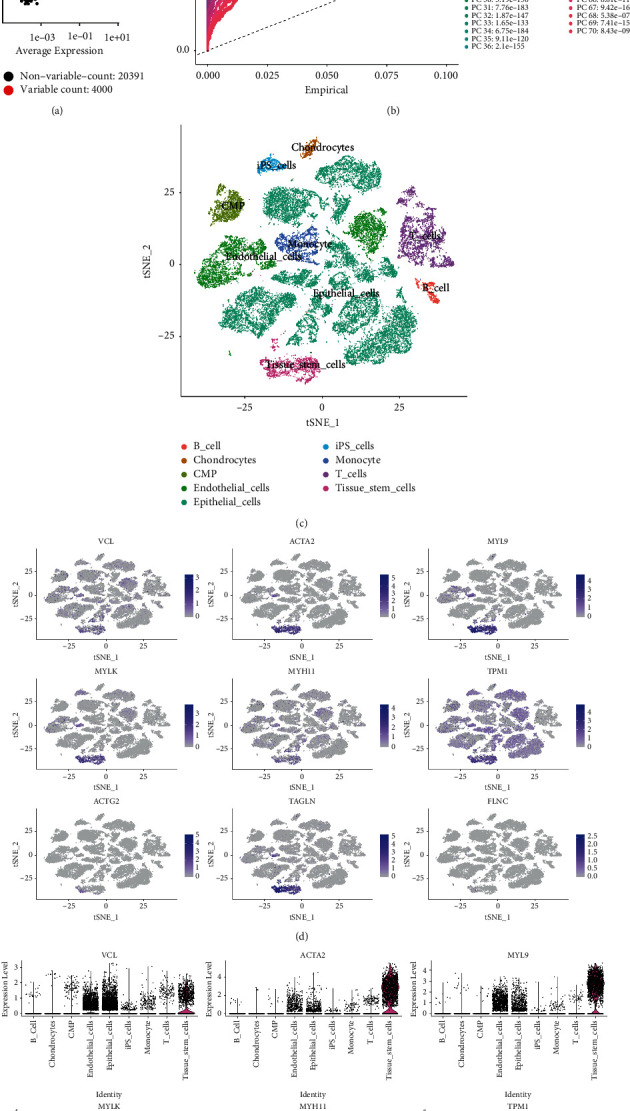
Figure 5.

Expression profiles of hub differentially infiltrated immune cell-related genes (DIICRGs) in cell subpopulations. (a) The characteristic variance diagram displays the genes with significant differences across cells. (b) Line chart displaying the significantly available dimensions of data sets with p value <0.05, which were identified using principal component analysis. PC, principal component. (c) The annotated cell subpopulations using SingleR. (d) Mapping of hub gene expressions in the epithelial, tissue stem and endothelial cells via the tSNE method. (e) Hub gene expressions in the epithelial, tissue stem and endothelial cells.
