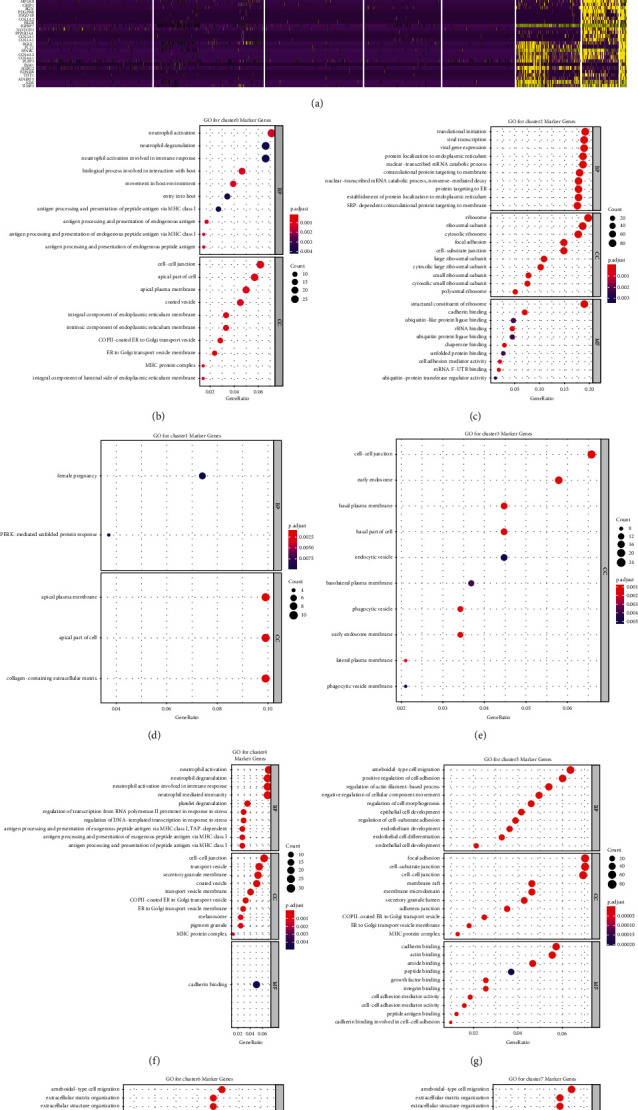
Figure 8.

Function analysis of each cluster in prostate cancer (PRAD). (a) Heat map demonstrating the top 20% significant marker genes with the criteria of |log2FoldChange|> 0.5 and p value <0.05. Gene ontology enrichment analysis with adjusted p-values for (b) cluster 0, (c) cluster 1, (d) cluster 2, (e) cluster 3, (f) cluster 4, (g) cluster 5, (h) cluster 6, and (i) cluster 7 marker genes.
