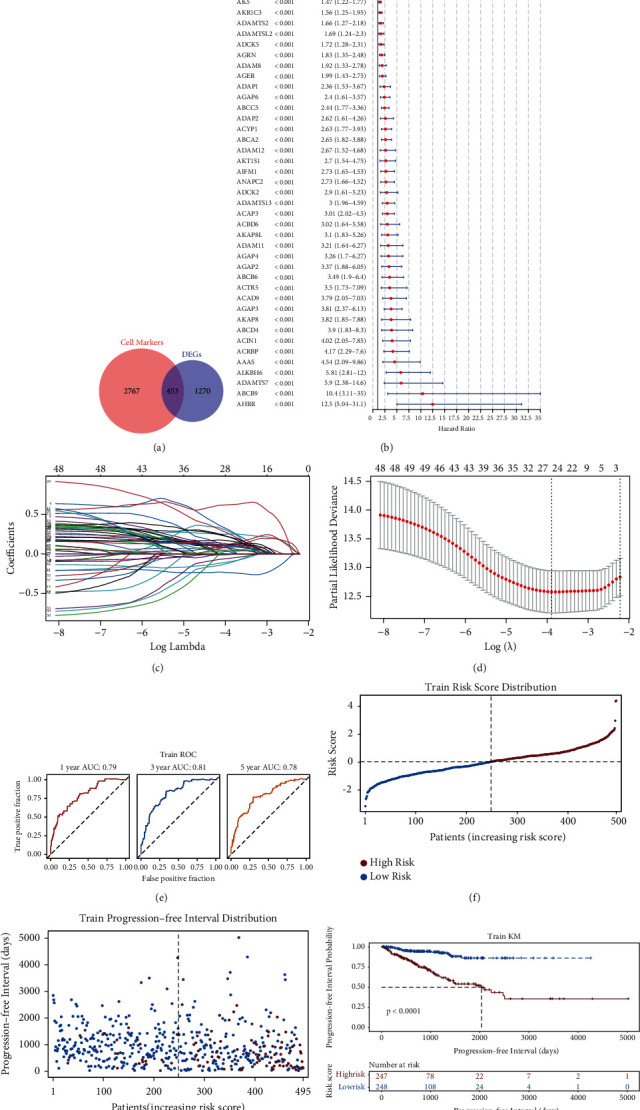
Figure 9.

Construction of a prognosis signature of 25 genes in prostate cancer (PRAD). (a) A total of 453 genes overlapped the marker genes, which were obtained from Figure 8(a), and the differentially expressed genes (DEGs) using the venn diagram. (b) Univariate Cox regression analysis revealed 53 genes significantly linked to the progression-free interval (PFI) at a p -value <0.05. (c) The coefficients of the 53 genes are shown using the lambda parameter. (d) The optimal genes are determined using LASSO regression analysis to construct the risk model. (e) Receiver operating characteristic (ROC) curve analysis for 1-, 3- and 5-year PFI using the TCGA training set. (f) Patients with PRAD in the TCGA cohort are listed in ascending order of risk score. (g) PFI distribution versus the risk score of each patient in the TCGA-PRAD cohort. (h) Kaplan–Meier curves of patients having different risk levels in the internal TCGA training set.
