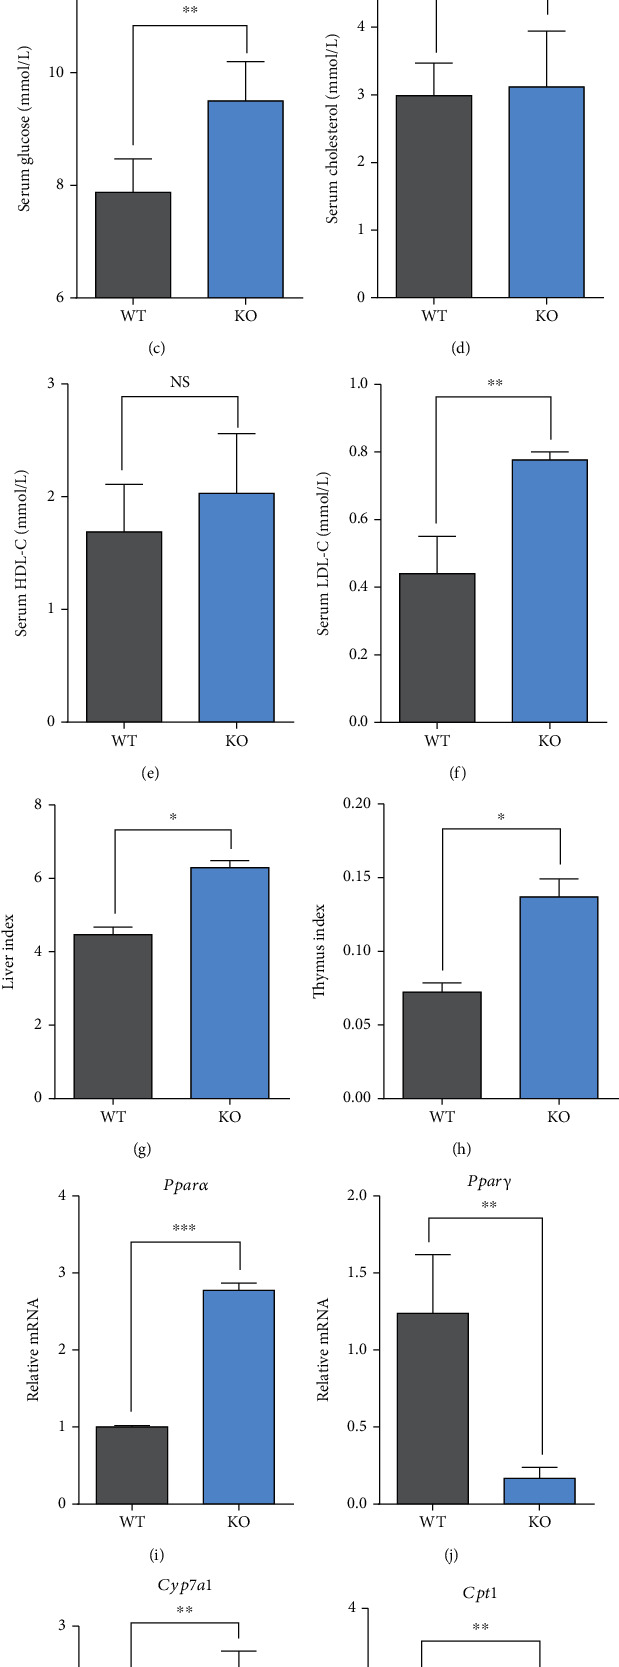
Figure 2.

Serum indicators, organ weights, and the relative expression levels of hepatic lipid metabolism-related genes in KO and WT mice. WT: wild-type (Period2+/+) mice; KO: Per2 gene knockout (Period2−/−) mice. Representative charts of the serum concentrations of ALT (a), AST (b), glucose (c), cholesterol (d), HDL-C (e), LDL-C (f), liver index (g), and thymus index (h) were measured in Per2 knockout and wild-type mice. The relative expression levels of Pparα (i), Pparγ (j), Cyp7a1 (k), and Cpt1 (I) were determined in liver tissues of Per2 knockout and wild-type mice by RT-PCR method. ∗, P < 0.05, significant difference; ∗∗ or ∗∗∗, P < 0.01 or P < 0.001, extremely significant difference; NS, P > 0.05, without a difference. Data were shown as mean ± SEM; n = 6 biological replicates.
