
Figure 6.
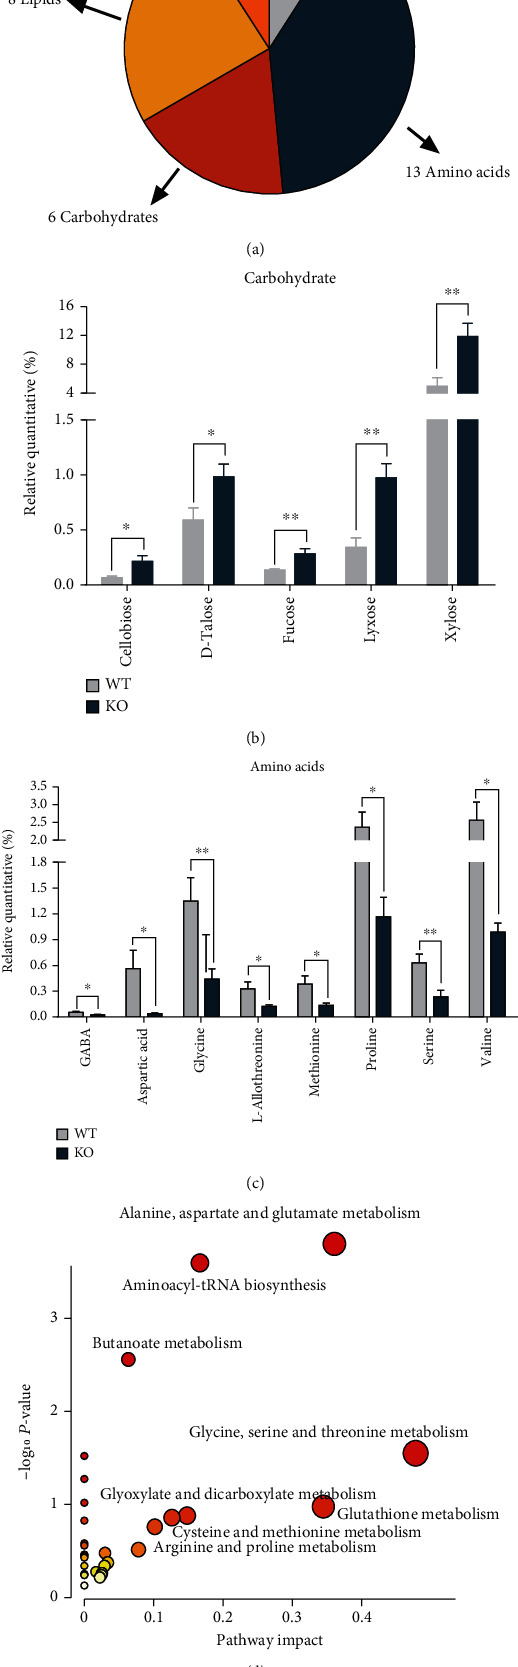
The characterization and functional analysis of key metabolites. WT: wild-type (Period2+/+) mice; KO: Per2 gene knockout (Period2−/−) mice. (a) The classification of significantly differential metabolites. (b) Bar chart of the significant differential metabolites belonged to amino acids. (c) Bar chart of the significant differential metabolites belonged to carbohydrates. (d) Significant metabolic pathway maps enriched in KEGG database. Large sizes and dark colors represent high pathway impact and major pathway enrichment, respectively.