
Figure 7.
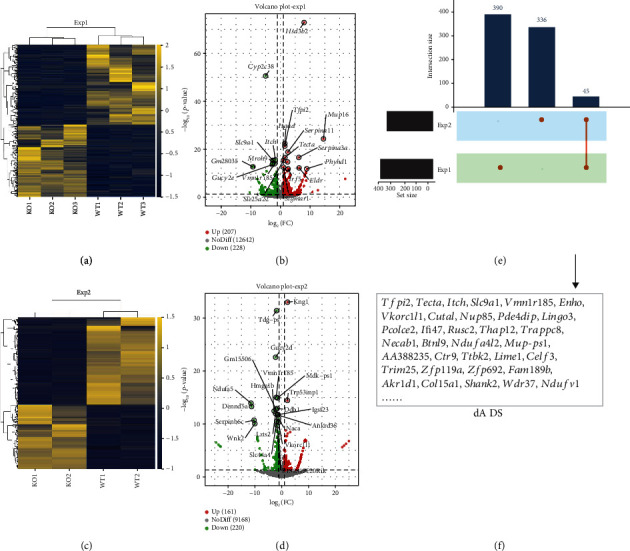
Hepatic transcriptome sequencing profiles in KO and WT mice. WT: wild-type (Period2+/+) mice; KO: Per2 gene knockout (Period2−/−) mice. The differentially expressed genes (DEGs) were screened out by setting P < 0.05 and |log2fold change| > 1 as threshold. (a) The heat map of the DEGs in Exp1. (b) The volcano plot of the DEGs in Exp1; red dots represent upregulated, and green dots represent downregulated. (c) The heat map of the DEGs in Exp2. (d) The volcano plot of the DEGs in Exp2; red dots represent upregulated, and green dots represent downregulated. (e) Bar chart of the number of DEGs in Exp1, Exp2, and their coexpressed genes. (f) The list of coexpressed DEGs in Exp1 and Exp2.