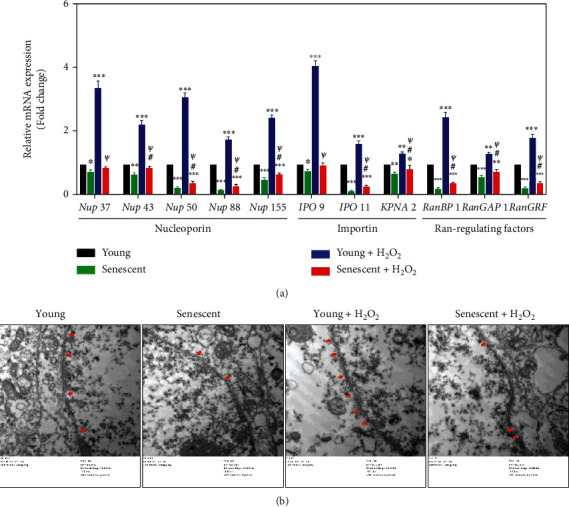
Figure 6.

The impaired nucleocytoplasmic trafficking in senescent LECs under oxidative stress. The young and senescent LECs were exposed to 200 μM H2O2 for 4 h. (a) The nucleocytoplasmic trafficking gene expressions were measured with qPCR. (b) NPCs (red arrows) in young and senescent LECs under oxidative stress were observed by a transmission electron microscope. Data are shown as mean ± SEM, n = 3, one-way ANOVA, ∗P < 0.05, ∗∗P < 0.01, and ∗∗∗P < 0.001, compared with young LECs. #P < 0.05, compared with senescent LECs. ψP < 0.05, compared with H2O2-treated young LECs.
