
Figure 2.
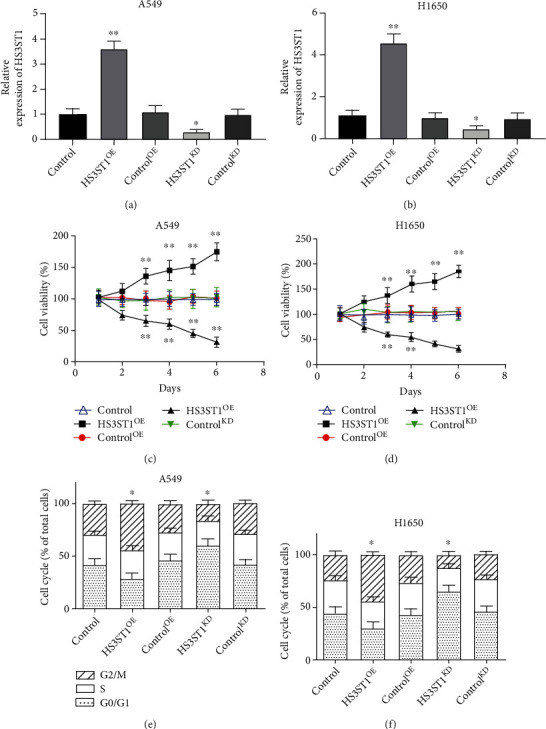
The impacts of HS3ST1 on proliferation and cell cycle distribution in NSCLC cells. (a) The HS3ST1 mRNA levels in A549 cells after they were treated with HS3ST1 overexpression or knockdown. (b) HS3ST1 mRNA levels in H1650 cells after they were treated with HS3ST1 overexpression or knockdown. (c) The impacts of HS3ST1 knockdown or overexpression on the viability of A549 cells. (d) The effects of HS3ST1 knockdown or overexpression on the viability of H1650 cells. (e) Impacts of HS3ST1 knockdown or overexpression on the cell cycle distribution of A549 cells. (f) Effects of HS3ST1 overexpression or knockdown on the cell cycle distribution of H1650 cells. ∗∗P < 0.01 in contrast with control and ∗P < 0.05 in contrast with control, N = 12.