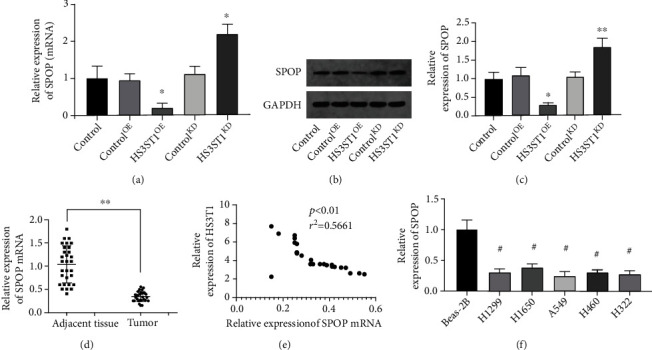
Figure 7.

The impact of HS3ST1 on SPOP expression in NSCLC. (a) The effects of HS3ST1 knockdown or overexpression on the mRNA levels of SPOP in A549 cells. (b and c) The effects of HS3ST1 knockdown or overexpression on the protein expression of SPOP in A549 cells. (d) The mRNA level of SPOP in NSCLC samples and adjoining normal samples. (e) The correlation of HS3ST1 and SPOP mRNA expression in NSCLC tumors. (f) The level of SPOP expression in NSCLC cell lines and BEAS-2B cells. ∗P < 0.05 in contrast with control, ∗∗P < 0.01 in contrast with control, and #P < 0.01 in contrast with BEAS-2B, N = 10.
