
Figure 7.
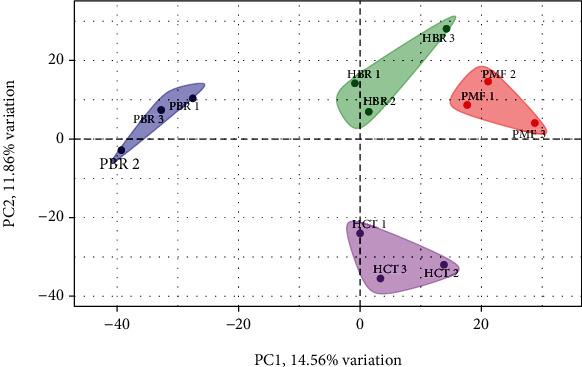
Principal component analysis (PCA) of the proteomic data in a 2-dimensionalgraph of PC1 and PC2. The biplot shows proteomic data (scores) as labeled dots and cell types as vectors for the parental (HCT and PMF) and butyrate-resistant (HBR and PBR) cells. Abbreviations: HCT: HCT parental cells; HBR: butyrate-resistant HCT cells; PMF: PMF parental cells; PBR: butyrate-resistant PMF cells.