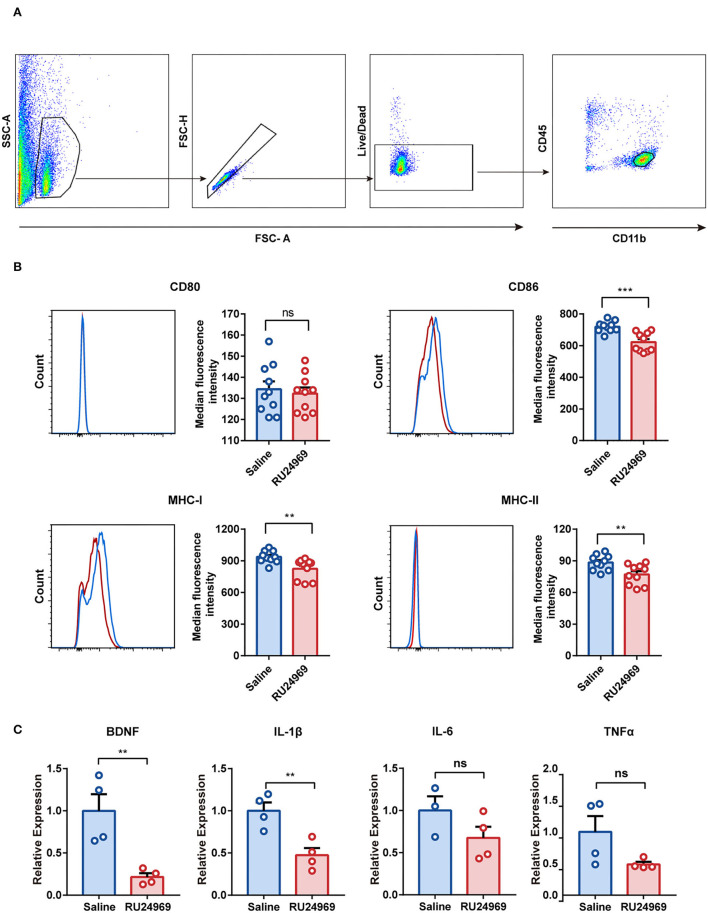
Figure 3.
RU24969 resulted in decreased microglial function. (A) Microglia were isolated by flow cytometry according to the difference in surface antigen markers. (B) Quantitative comparison of the median fluorescence intensity of CD80, CD86, MHC-I, and MHC-II in microglia between the two groups (n = 10 mice, CD80: 134.3 ± 3.751 vs. 132.3 ± 2.868, t18 = 0.4236, P = 0.6769; CD86: 720.1 ± 10.88 vs. 622.3 ± 18.96, t18 = 4.475, P < 0.001; MHC-I: 936.9 ± 18.14 vs. 824.2 ± 30.74, t18 = 3.158, P < 0.01; MHC-II: 88.4 ± 2.288 vs. 77.08 ± 3.072, t18 = 2.955, P < 0.01). (C) Expression of BDNF, IL-1β, IL-6, and TNFα in microglia (n = 4 mice; one outlier was discarded from the IL-6 dataset. BDNF: 1 ± 0.1955 vs. 0.2158 ± 0.04455, t6 = 3.911, P < 0.01; IL-1β: 1 ± 0.09866 vs. 0.4733 ± 0.08598, t6 = 4.025, P < 0.01; IL-6: 1 ± 0.1684 vs. 0.6752 ± 0.1326, t5 = 1.54, P = 0.1842; TNFα: 1 ± 0.2486 vs. 0.4874 ± 0.03895, t6 = 2.037, P = 0.0878). Data are presented as mean ± SEM. Data were analyzed using a two-tailed Student's t-test. **P < 0.01, ***P < 0.001, ns stands for “not significant”.

