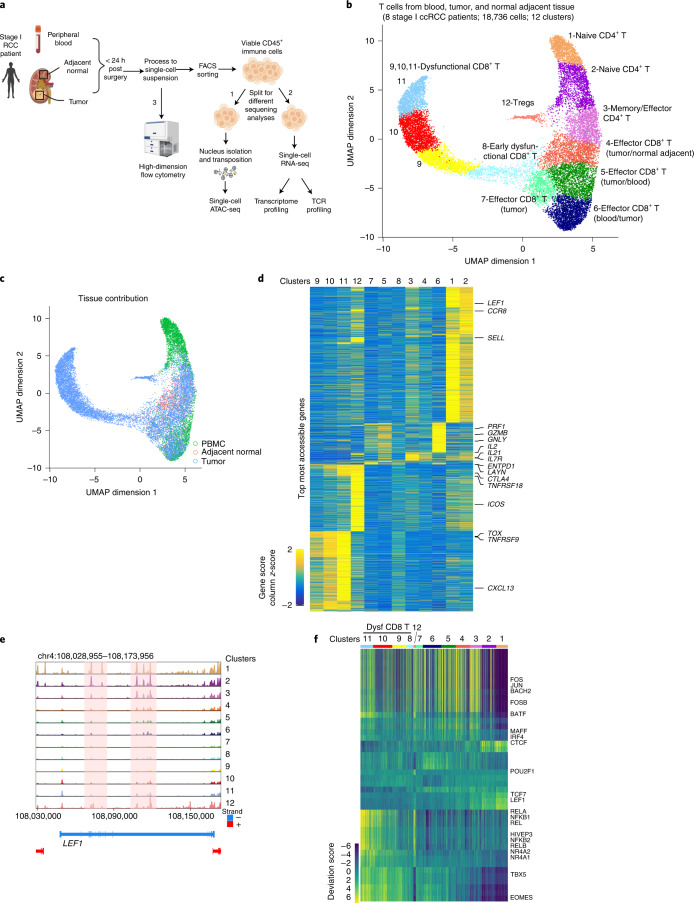
Fig. 1. Single-cell chromatin accessibility of T cells in ccRCC.
a, Schematic of chromatin accessibility, transcriptome and TCR profiling, and validation at the protein level of cells from peripheral blood, tumor tissue and adjacent normal tissue in early-stage ccRCC patients. Imaged created with BioRender.com. b, UMAP projection of 18,736 scATAC-seq profiles of T cells from peripheral blood, tumor tissue and adjacent normal tissue combining eight patient samples. Dots represent individual cells and colors indicate cluster identity, specified next to each cluster. c, UMAP projection of T cells colored by tissue of origin. d, Heatmap of gene activity scores of the most accessible genes in each cluster (LFC ≥ 1, FDR ≤ 0.05 compared with other clusters) derived from b. e, Genome tracks of aggregate scATAC-seq data visualization of the LEF1 locus, clustered as indicated in b. f, Heatmap representation of ATAC-seq chromVAR bias-corrected deviations in the 49 most variable TFs across all scATAC-seq clusters. Cluster identities are indicated at the top of the plot.

